Plumber Salary in St. Louis, MO: $78,940 (2026)
Quick Answer:A full-time plumber in St. Louis, MO earns a median $78,940/year (≈ $37.95/hour) in nominal terms for 2026 — projected from BLS OEWS 2025 (SOC 47-2152). Once you factor in St. Louis's price level (5% below national, BEA RPP 95.1), that paycheck buys what $83,018 would nationally. Nominal pay sits 18.9% above the Missouri state average.
Official BLS data · View source
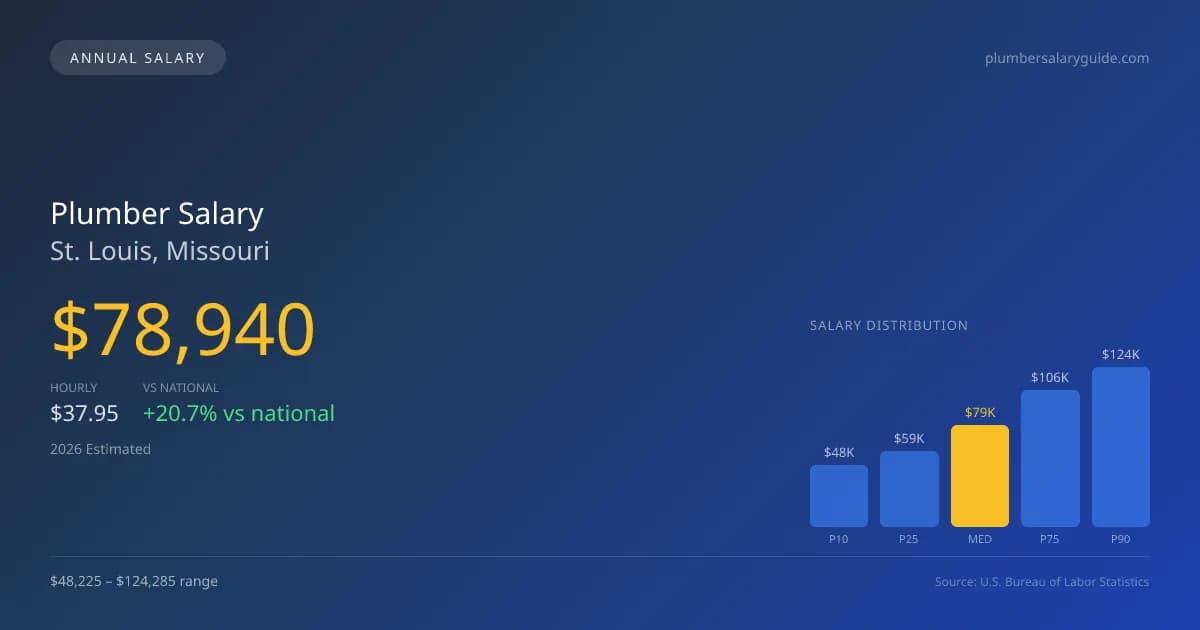
In St. Louis, Missouri, the anticipated median annual salary for plumbers in 2026 reaches $78,940, reflecting a notable premium compared to the national figure of $65,408. This strong positioning in the local job market demonstrates the value placed on specialized skills, particularly in areas such as medical gas installation and industrial maintenance, which can significantly enhance earning potential. The salary range varies widely, with the lowest 10% earning about $48,225 and the top 90% achieving salaries around $124,285, showcasing the diverse opportunities within this occupation. This data is sourced from the Bureau of Labor Statistics (BLS) through its Occupational Employment and Wage Statistics (OEWS) program, highlighting a healthy landscape for plumbing professionals in St. Louis, characterized by a steady demand for skilled trades.
Salary Breakdown
| Percentile | Annual | Hourly |
|---|---|---|
| Entry Level (P10) | $48,225 | $23.18 |
| Lower Range (P25) | $58,877 | $28.31 |
| Median (P50)(typical) | $78,940 | $37.95 |
| Upper Range (P75) | $106,447 | $51.18 |
| Top Earners (P90) | $124,285 | $59.76 |
Median Salary Position
20.69% above the national average
2026 Salary Percentile Distribution in St. Louis
In St. Louis, MO, the plumber salary spread from the 10th to 90th percentile is $76,060 (2026 est.). At $78,940, the local median is 20.69% above the national median of $65,408.
Salary Calculator
At 40 hours/week in St. Louis: You'd be in the lower-middle range
How St. Louis Plumber Pay Compares
St. Louis median: $78,940/year (2026)
| Compared To | Median Salary | St. Louis Pays |
|---|---|---|
| Missouri Average | $66,392 | +18.90% more |
| National Average | $65,408 | +20.69% more |
Plumbers in St. Louis, MO earn a median of $78,940 per year (2026 est.), which is 20.69% higher than the national median of $65,408 and 18.90% above the Missouri state average of $66,392.
Cost-of-Living Adjusted Salary
St. Louis has a cost of living 4.91% below the national average, meaning your salary goes further here.
Adjusted salary = nominal × (100 / CoL index). CoL index: 100 = national average.
St. Louis, MO has a cost-of-living index of 95.088 (below the national average of 100). A plumber earning $78,940 nominally has purchasing power equivalent to $83,018 in an average-cost city — an effective 5.17% boost.
Compare Purchasing Power
Select a city to see how your salary compares after cost of living
Select a city above to compare purchasing power
2019 BLS Actual
$82,200
2025 BLS Actual
$77,000
2026 Current Est.
$78,940
2019–2027 Growth
+-1.5%
Salary Trajectory for Plumbers in St. Louis (2019–2027)
2019–2025: actual BLS OEWS data for this metro area. 2026+: CAGR 2.52% projection.
| Year | Annual Salary | Status |
|---|---|---|
| 2019 | $82,200 | Actual |
| 2020 | $80,570 | Actual |
| 2021 | $64,040 | Actual |
| 2022 | $75,390 | Actual |
| 2023 | $77,560 | Actual |
| 2024 | $73,060 | Actual |
| 2025 | $77,000 | Actual |
| 2026(current) | $78,940 | Estimated |
| 2027 | $80,930 | Projected |
Based on 7 years of BLS OEWS data for the St. Louis metropolitan area, the median plumber salary grew -6.3% from $82,200 (2019) to $77,000 (2025). At a 2.52% compound annual growth rate, salaries are projected to reach $80,930 by 2027 — a total increase of $-1,270 (-1.55%) from 2019.
Note: Historical values (2019–2025) are actual BLS OEWS figures for the St. Louis metropolitan area, sourced from annual Occupational Employment and Wage Statistics surveys. 2026–2026 figures are current estimates, and 2027 values are projections, calculated using a 2.52% CAGR derived from 7-year BLS historical data. Actual salaries may vary based on employer, experience, certifications, and local market conditions.
Salary by Experience Level
| Experience | Estimated Salary Range |
|---|---|
| 0-2 years (New Graduate) | $48,225 – $58,877 |
| 3-5 years (Mid Career) | $58,877 – $78,940 |
| 5+ years (Experienced) | $78,940 – $106,447 |
| 10+ years (Top Earner) | $106,447 – $124,285 |
Plumber salary ranges estimated from BLS percentile data. Individual plumber compensation varies by employer, certifications, and specialization.
Plumber Job Market in St. Louis
The job market for plumbers in St. Louis comprises roughly 4,060 employed individuals, reflecting a robust local industry shaping plumber pay in St. Louis MO. A cost-of-living index of 95.088 indicates that while wages may be higher than the national average, they maintain relative purchasing power for residents. Among the highest-paying employers, union plumbing contractors generally offer lucrative compensation packages, often eclipsing their non-union counterparts due to the union pipefitter premium. In contrast, self-employed plumbers and those working for large service companies such as Roto-Rooter often operate under commission structures, resulting in greater variability in earnings. Factors driving salary disparities include specialization in high-demand areas like medical gas and backflow prevention, as well as credentials such as a master plumber license. With an aging workforce and infrastructure, those pursuing additional certifications and gaining experience within Union frameworks could strategize to maximize their earning potential in this evolving market.
More salary data for St. Louis, MO:
Frequently Asked Questions
How much do plumbers make in St. Louis, MO in 2026?
Is St. Louis, MO a good place to work as a plumber?
Can plumbers make $100K in St. Louis?
What is the cost-of-living adjusted plumber salary in St. Louis?
How much does a plumber make per hour in St. Louis?
Related Pages
Compare Salaries
Career Resources
Nearby Cities in Missouri
Written by Samuel Torres, CWP
Career Analyst
Samuel Torres has 10 years of experience in plumbing. He specializes in residential plumbing systems. He has worked with several home improvement companies.
Methodology & Data Source
Salary figures on this page are 2026 projections based on the Bureau of Labor Statistics Occupational Employment and Wage Statistics (OEWS) survey, May 2026 release. The BLS reported a median annual salary of $77,000 for plumbersin the St. Louis metropolitan area. A 2.52% compound annual growth rate (CAGR), calculated from 6-year national BLS wage trends, was applied to project current 2026 compensation. Percentile ranges (P10–P90) represent the full salary distribution across experience levels and practice settings in this market.
Data Sources & Methodology
Source: BLS, OEWS, 7-year dataset (–). Per-city data from annual BLS metropolitan area surveys.
2026 figures are projected from 2025 BLS data using a compound annual growth rate (CAGR) of 2.52%, derived from historical BLS wage trends for plumbers (SOC 47-2152).
Compiled and verified by Samuel Torres, CWP, a licensed plumber with 10+ years of clinical experience. · View source data at BLS.gov