Plumber Salary in Springfield, MO: $62,958 (2026)
Quick Answer:A full-time plumber in Springfield, MO earns a median $62,958/year (≈ $30.26/hour) in nominal terms for 2026 — projected from BLS OEWS 2025 (SOC 47-2152). Once you factor in Springfield's price level (11% below national, BEA RPP 88.6), that paycheck buys what $71,071 would nationally. Nominal pay sits 5.2% below the Missouri state average.
Official BLS data · View source
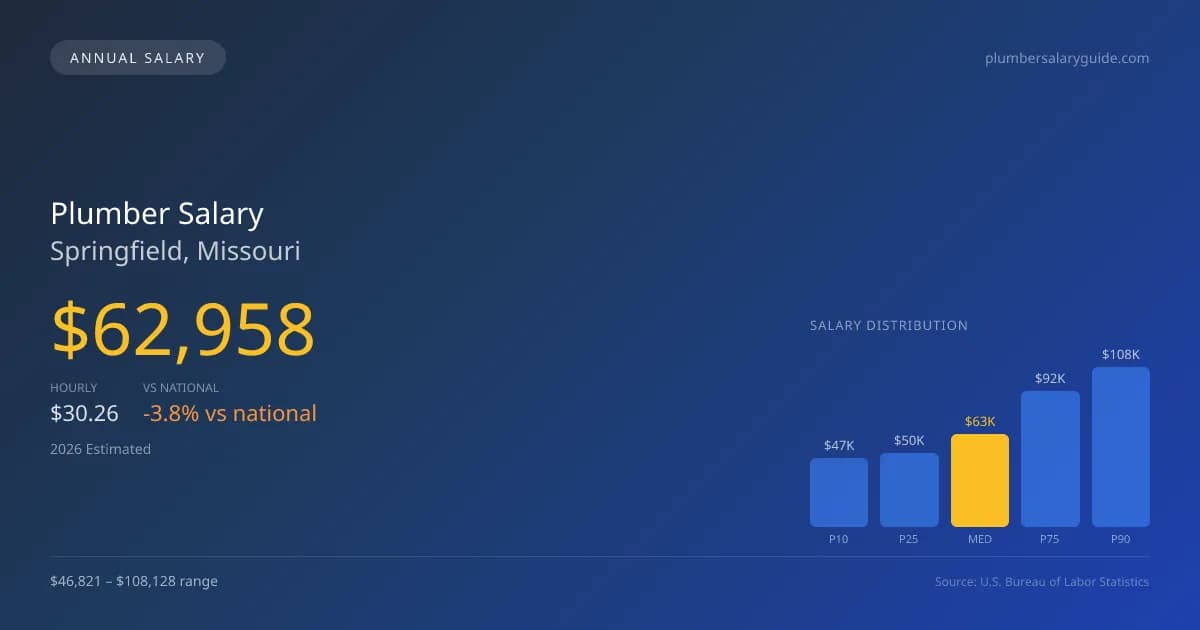
In 2026, a plumber salary in Springfield, Missouri is projected to reach a median annual amount of $62,958. This figure is slightly below the national average of $65,408, highlighting a modest 3.75% gap. The salary range for plumbers in Springfield varies significantly, with entry-level positions starting around $46,821 (P10) and more experienced professionals earning upwards of $108,128 (P90). These insights come from official BLS OEWS surveys, providing a reliable snapshot of the local job market. For plumbers looking to specialize in high-demand areas such as medical gas or industrial pipefitting, the potential for increased earnings is substantial, making Springfield an attractive option for those with the right credentials seeking to maximize their salaries.
Salary Breakdown
| Percentile | Annual | Hourly |
|---|---|---|
| Entry Level (P10) | $46,821 | $22.51 |
| Lower Range (P25) | $50,296 | $24.18 |
| Median (P50)(typical) | $62,958 | $30.26 |
| Upper Range (P75) | $92,135 | $44.30 |
| Top Earners (P90) | $108,128 | $51.99 |
Median Salary Position
3.75% below the national average
2026 Salary Percentile Distribution in Springfield
In Springfield, MO, the plumber salary spread from the 10th to 90th percentile is $61,307 (2026 est.). At $62,958, the local median is 3.75% below the national median of $65,408.
Salary Calculator
At 40 hours/week in Springfield: You'd be in the lower-middle range
How Springfield Plumber Pay Compares
Springfield median: $62,958/year (2026)
| Compared To | Median Salary | Springfield Pays |
|---|---|---|
| Missouri Average | $66,411 | -5.20% less |
| National Average | $65,408 | -3.75% less |
Plumbers in Springfield, MO earn a median of $62,958 per year (2026 est.), which is 3.75% lower than the national median of $65,408 and 5.20% below the Missouri state average of $66,411.
Cost-of-Living Adjusted Salary
Springfield has a cost of living 11.42% below the national average, meaning your salary goes further here.
Adjusted salary = nominal × (100 / CoL index). CoL index: 100 = national average.
Springfield, MO has a cost-of-living index of 88.585 (below the national average of 100). A plumber earning $62,958 nominally has purchasing power equivalent to $71,071 in an average-cost city — an effective 12.89% boost.
Compare Purchasing Power
Select a city to see how your salary compares after cost of living
Select a city above to compare purchasing power
2019 BLS Actual
$54,370
2025 BLS Actual
$61,410
2026 Current Est.
$62,958
2019–2027 Growth
+18.7%
Salary Trajectory for Plumbers in Springfield (2019–2027)
2019–2025: actual BLS OEWS data for this metro area. 2026+: CAGR 2.52% projection.
| Year | Annual Salary | Status |
|---|---|---|
| 2019 | $54,370 | Actual |
| 2020 | $50,280 | Actual |
| 2021 | $47,040 | Actual |
| 2022 | $48,900 | Actual |
| 2023 | $54,120 | Actual |
| 2024 | $57,760 | Actual |
| 2025 | $61,410 | Actual |
| 2026(current) | $62,958 | Estimated |
| 2027 | $64,544 | Projected |
Based on 7 years of BLS OEWS data for the Springfield metropolitan area, the median plumber salary grew 12.9% from $54,370 (2019) to $61,410 (2025). At a 2.52% compound annual growth rate, salaries are projected to reach $64,544 by 2027 — a total increase of $10,174 (18.71%) from 2019.
Note: Historical values (2019–2025) are actual BLS OEWS figures for the Springfield metropolitan area, sourced from annual Occupational Employment and Wage Statistics surveys. 2026–2026 figures are current estimates, and 2027 values are projections, calculated using a 2.52% CAGR derived from 7-year BLS historical data. Actual salaries may vary based on employer, experience, certifications, and local market conditions.
Salary by Experience Level
| Experience | Estimated Salary Range |
|---|---|
| 0-2 years (New Graduate) | $46,821 – $50,296 |
| 3-5 years (Mid Career) | $50,296 – $62,958 |
| 5+ years (Experienced) | $62,958 – $92,135 |
| 10+ years (Top Earner) | $92,135 – $108,128 |
Plumber salary ranges estimated from BLS percentile data. Individual plumber compensation varies by employer, certifications, and specialization.
Plumber Job Market in Springfield
The job market for plumbers in Springfield supports approximately 660 professionals, fostering an environment where skilled labor is in demand. The cost-of-living index of 88.585 suggests that take-home pay has greater purchasing power compared to national averages. Among local employers, union plumbing contractors, especially those affiliated with the UA (United Association), tend to pay the most, benefiting from premium wages that can exceed non-union rates significantly. The disparity between low and high wages often comes down to specialization; for instance, those engaged in medical gas work or industrial settings generally see higher compensation compared to those in residential services. To advance their earnings in Springfield, plumbers should consider obtaining specialty certifications, pursuing union affiliation, or establishing their own businesses to capitalize on high-demand niches. This strategic approach can yield favorable returns in a competitive market.
More salary data for Springfield, MO:
Frequently Asked Questions
How much do plumbers make in Springfield, MO in 2026?
Is Springfield, MO a good place to work as a plumber?
Can plumbers make $100K in Springfield?
What is the cost-of-living adjusted plumber salary in Springfield?
How much does a plumber make per hour in Springfield?
Related Pages
Compare Salaries
Career Resources
Nearby Cities in Missouri
Written by Samuel Torres, CWP
Career Analyst
Samuel Torres has 10 years of experience in plumbing. He specializes in residential plumbing systems. He has worked with several home improvement companies.
Methodology & Data Source
Salary figures on this page are 2026 projections based on the Bureau of Labor Statistics Occupational Employment and Wage Statistics (OEWS) survey, May 2026 release. The BLS reported a median annual salary of $61,410 for plumbersin the Springfield metropolitan area. A 2.52% compound annual growth rate (CAGR), calculated from 6-year national BLS wage trends, was applied to project current 2026 compensation. Percentile ranges (P10–P90) represent the full salary distribution across experience levels and practice settings in this market.
Data Sources & Methodology
Source: BLS, OEWS, 7-year dataset (–). Per-city data from annual BLS metropolitan area surveys.
2026 figures are projected from 2025 BLS data using a compound annual growth rate (CAGR) of 2.52%, derived from historical BLS wage trends for plumbers (SOC 47-2152).
Compiled and verified by Samuel Torres, CWP, a licensed plumber with 10+ years of clinical experience. · View source data at BLS.gov