Plumber Salary in Kansas City, MO: $78,069 (2026)
Quick Answer:A full-time plumber in Kansas City, MO earns a median $78,069/year (≈ $37.53/hour) in nominal terms for 2026 — projected from BLS OEWS 2025 (SOC 47-2152). Once you factor in Kansas City's price level (7% below national, BEA RPP 92.5), that paycheck buys what $84,360 would nationally. Nominal pay sits 17.6% above the Missouri state average.
Official BLS data · View source
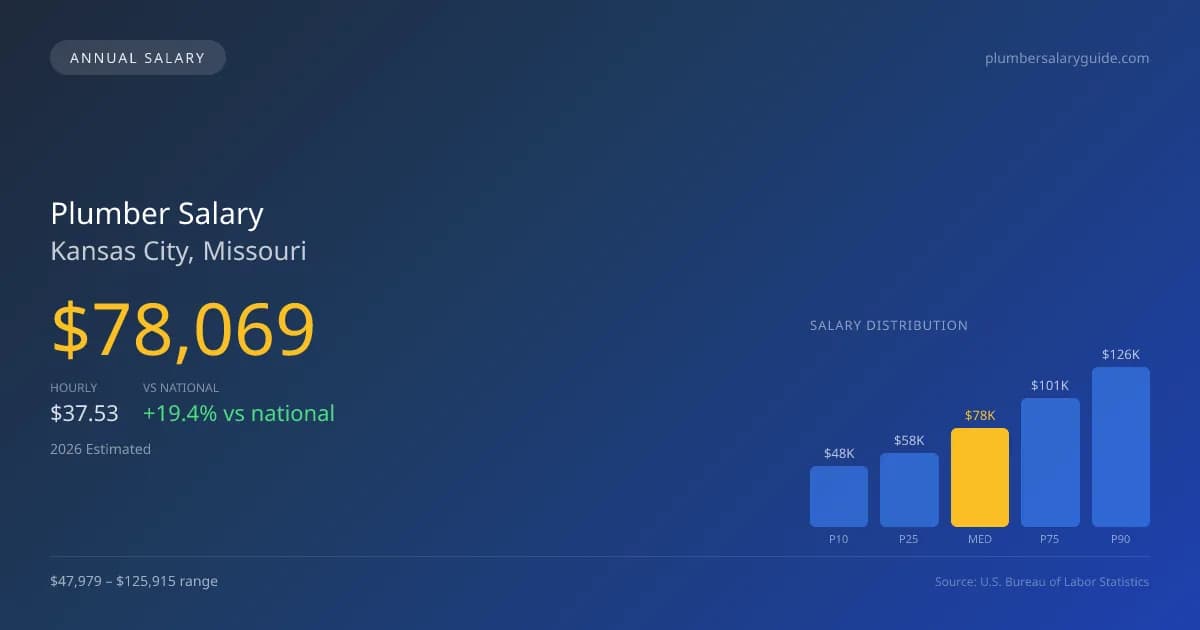
In Kansas City, Missouri, plumbers can expect competitive compensation, with a median annual salary projected at $78,069 for 2026. This figure is notably higher than the national median of $65,408, representing a 19.36% premium for local plumbers. The local salary ranges widely, from $47,979 at the lower end (10th percentile) to $125,915 at the high end (90th percentile), reflecting diverse experience levels and specialties. This data is derived from 2025 BLS OEWS surveys, which highlight the increasing demand for skilled plumbing professionals, particularly those with specialized knowledge in medical gas and industrial systems. With a growing number of plumbing jobs, Kansas City’s market offers robust opportunities for plumbers looking to advance their careers.
Salary Breakdown
| Percentile | Annual | Hourly |
|---|---|---|
| Entry Level (P10) | $47,979 | $23.07 |
| Lower Range (P25) | $58,457 | $28.11 |
| Median (P50)(typical) | $78,069 | $37.53 |
| Upper Range (P75) | $101,485 | $48.79 |
| Top Earners (P90) | $125,915 | $60.54 |
Median Salary Position
19.36% above the national average
2026 Salary Percentile Distribution in Kansas City
In Kansas City, MO, the plumber salary spread from the 10th to 90th percentile is $77,936 (2026 est.). At $78,069, the local median is 19.36% above the national median of $65,408.
Salary Calculator
At 40 hours/week in Kansas City: You'd be in the lower-middle range
How Kansas City Plumber Pay Compares
Kansas City median: $78,069/year (2026)
| Compared To | Median Salary | Kansas City Pays |
|---|---|---|
| Missouri Average | $66,385 | +17.60% more |
| National Average | $65,408 | +19.36% more |
Plumbers in Kansas City, MO earn a median of $78,069 per year (2026 est.), which is 19.36% higher than the national median of $65,408 and 17.60% above the Missouri state average of $66,385.
Cost-of-Living Adjusted Salary
Kansas City has a cost of living 7.46% below the national average, meaning your salary goes further here.
Adjusted salary = nominal × (100 / CoL index). CoL index: 100 = national average.
Kansas City, MO has a cost-of-living index of 92.543 (below the national average of 100). A plumber earning $78,069 nominally has purchasing power equivalent to $84,360 in an average-cost city — an effective 8.06% boost.
Compare Purchasing Power
Select a city to see how your salary compares after cost of living
Select a city above to compare purchasing power
2019 BLS Actual
$66,600
2025 BLS Actual
$76,150
2026 Current Est.
$78,069
2019–2027 Growth
+20.2%
Salary Trajectory for Plumbers in Kansas City (2019–2027)
2019–2025: actual BLS OEWS data for this metro area. 2026+: CAGR 2.52% projection.
| Year | Annual Salary | Status |
|---|---|---|
| 2019 | $66,600 | Actual |
| 2020 | $64,010 | Actual |
| 2021 | $59,810 | Actual |
| 2022 | $61,550 | Actual |
| 2023 | $64,180 | Actual |
| 2024 | $72,600 | Actual |
| 2025 | $76,150 | Actual |
| 2026(current) | $78,069 | Estimated |
| 2027 | $80,036 | Projected |
Based on 7 years of BLS OEWS data for the Kansas City metropolitan area, the median plumber salary grew 14.3% from $66,600 (2019) to $76,150 (2025). At a 2.52% compound annual growth rate, salaries are projected to reach $80,036 by 2027 — a total increase of $13,436 (20.17%) from 2019.
Note: Historical values (2019–2025) are actual BLS OEWS figures for the Kansas City metropolitan area, sourced from annual Occupational Employment and Wage Statistics surveys. 2026–2026 figures are current estimates, and 2027 values are projections, calculated using a 2.52% CAGR derived from 7-year BLS historical data. Actual salaries may vary based on employer, experience, certifications, and local market conditions.
Salary by Experience Level
| Experience | Estimated Salary Range |
|---|---|
| 0-2 years (New Graduate) | $47,979 – $58,457 |
| 3-5 years (Mid Career) | $58,457 – $78,069 |
| 5+ years (Experienced) | $78,069 – $101,485 |
| 10+ years (Top Earner) | $101,485 – $125,915 |
Plumber salary ranges estimated from BLS percentile data. Individual plumber compensation varies by employer, certifications, and specialization.
Plumber Job Market in Kansas City
The local job market for plumbers in Kansas City includes approximately 3,740 professionals, indicating a solid demand for skilled labor in the area. With a cost-of-living index at 92.543, residents enjoy a lower cost than the national average, making take-home pay more impactful for those in the trade. Plumber pay in Kansas City fluctuates based on various employment situations; union contractors typically offer higher salaries compared to non-union counterparts. Employers such as large service companies and municipal water utilities often provide competitive wages, but the gap between low and high pay can be significant. Factors influencing this disparity include specialized skills, such as medical gas certifications and the ownership of master and contractor licenses, which can elevate earning potential. For plumbers seeking to maximize their salary in this market, focusing on obtaining advanced licenses and specialties, considering union affiliations, and leveraging service company commission structures can prove advantageous.
More salary data for Kansas City, MO:
Frequently Asked Questions
How much do plumbers make in Kansas City, MO in 2026?
Is Kansas City, MO a good place to work as a plumber?
Can plumbers make $100K in Kansas City?
What is the cost-of-living adjusted plumber salary in Kansas City?
How much does a plumber make per hour in Kansas City?
Related Pages
Compare Salaries
Career Resources
Nearby Cities in Missouri
Written by Samuel Torres, CWP
Career Analyst
Samuel Torres has 10 years of experience in plumbing. He specializes in residential plumbing systems. He has worked with several home improvement companies.
Methodology & Data Source
Salary figures on this page are 2026 projections based on the Bureau of Labor Statistics Occupational Employment and Wage Statistics (OEWS) survey, May 2026 release. The BLS reported a median annual salary of $76,150 for plumbersin the Kansas City metropolitan area. A 2.52% compound annual growth rate (CAGR), calculated from 6-year national BLS wage trends, was applied to project current 2026 compensation. Percentile ranges (P10–P90) represent the full salary distribution across experience levels and practice settings in this market.
Data Sources & Methodology
Source: BLS, OEWS, 7-year dataset (–). Per-city data from annual BLS metropolitan area surveys.
2026 figures are projected from 2025 BLS data using a compound annual growth rate (CAGR) of 2.52%, derived from historical BLS wage trends for plumbers (SOC 47-2152).
Compiled and verified by Samuel Torres, CWP, a licensed plumber with 10+ years of clinical experience. · View source data at BLS.gov