Plumber Salary in Missouri: $75,202 (2026)
Quick Answer:Across Missouri's 33 metropolitan areas, the average median plumber pay sits at $75,202/year heading into 2026 — a figure projected from 2025 BLS OEWS wage data for SOC 47-2152. Because Missouri sits at BEA RPP 89.6 (10% below the U.S. baseline), that statewide median translates to roughly $83,931 in nationally-comparable purchasing power. Highest-paying metros: St. Louis ($77,000), Kansas City ($76,150), St. Joseph ($68,290).
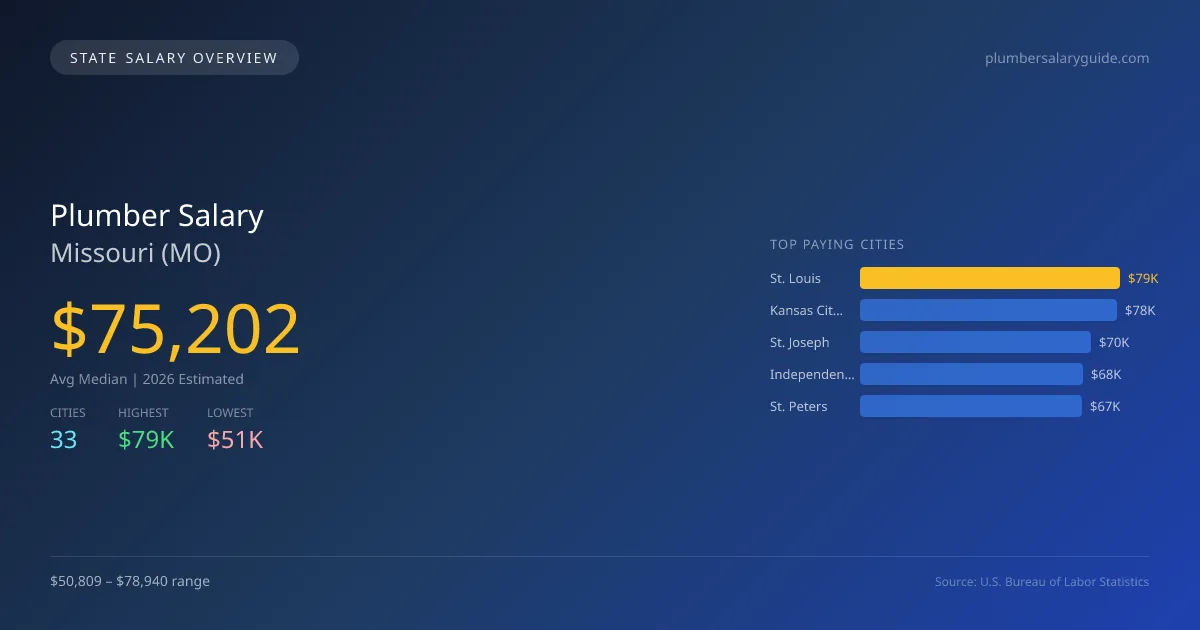
In Missouri, the average median salary for plumbers in 2026 is projected to be $75,201, which is a significant 15.0% above the national median of $65,408. This state has a varied salary landscape; St. Louis offers the highest average salary at $78,940, while Jefferson City has the lowest at $50,809, resulting in a notable gap of $28,131. The salary differences are driven by factors such as cost of living, demand for plumbing services, and the presence of larger metropolitan markets. Missouri has specific state licensing requirements that plumbers must meet, including completing an apprenticeship and passing an exam. The state's laws govern the scope of practice, which influences job responsibilities and potential earnings. Demand for plumbing services is expected to grow due to ongoing infrastructure needs and residential construction. With a projected growth rate of 2.52%, the job market for plumbers in Missouri shows steady movement, reflecting positive employment opportunities in the coming years. Key urban centers like Kansas City and St. Joseph also offer salaries close to the state average, aligning with the state's overall outlook for this profession. The strong employment figures, with 9,782 plumbers projected in the state, further support an optimistic trajectory for those entering this field.
Missouri Plumber Salary Range
Overall salary range in Missouri: $37,727 (lowest entry-level) to $125,915 (highest top earner)
Missouri vs National Average
Missouri plumbers earn 14.97% more than the national median (+$9,794/year difference).
Missouri Plumber Salary Distribution (2026)
Plumber salaries in Missouri range from $47,364 (entry-level, 10th percentile) to $121,218 (top earners, 90th percentile), with a median of $75,202. The Missouri median is $9,794 above the US national median of $65,408. The average hourly rate is $36.15/hr. Approximately 9,782 plumbers are employed across 33 cities.
2019 BLS Actual
$71,650
2025 BLS Actual
$73,353
2026 Current Est.
$75,202
2019–2027 Growth
+7.6%
Salary Trajectory for Plumbers in Missouri (2019–2027)
2019–2025: actual BLS OEWS data for this metro area. 2026+: CAGR 2.52% projection.
| Year | Annual Salary | Status |
|---|---|---|
| 2019 | $71,650 | Actual |
| 2020 | $70,160 | Actual |
| 2021 | $59,912 | Actual |
| 2022 | $66,390 | Actual |
| 2023 | $68,992 | Actual |
| 2024 | $69,693 | Actual |
| 2025 | $73,353 | Actual |
| 2026(current) | $75,202 | Estimated |
| 2027 | $77,097 | Projected |
Based on 7 years of BLS OEWS data for the Missouri metropolitan area, the median plumber salary grew 2.4% from $71,650 (2019) to $73,353 (2025). At a 2.52% compound annual growth rate, salaries are projected to reach $77,097 by 2027 — a total increase of $5,447 (7.60%) from 2019.
Note: Historical values (2019–2025) are actual BLS OEWS figures for the Missouri metropolitan area, sourced from annual Occupational Employment and Wage Statistics surveys. 2026–2026 figures are current estimates, and 2027 values are projections, calculated using a 2.52% CAGR derived from 7-year BLS historical data. Actual salaries may vary based on employer, experience, certifications, and local market conditions.
Top 5 Highest Paying Cities in Missouri
Lowest Paying Cities in Missouri
| City | Median Salary |
|---|---|
| Jefferson City | $50,809 |
| Columbia | $59,472 |
| Hannibal | $61,277 |
| Raymore | $61,476 |
| Branson | $61,711 |
Best Value Cities for Plumbers in Missouri
When adjusted for local cost of living, these Missouri cities offer the most purchasing power for plumbers.
| City | Nominal Salary | CoL Index | Adjusted Salary |
|---|---|---|---|
| Kansas City | $78,069 | 92.543 | $84,360 |
| St. Louis | $78,940 | 95.088 | $83,018 |
| St. Joseph | $70,011 | 86.382 | $81,048 |
| Cape Girardeau | $66,823 | 86.078 | $77,631 |
| Joplin | $65,992 | 85.718 | $76,987 |
Adjusted salary = nominal salary × (100 / CoL index). CoL index: 100 = national average. Lower index = lower cost of living.
Salary by Experience Level in Missouri
| Experience Level | Estimated Annual |
|---|---|
| Entry Level (0-2 years) | $47,364 |
| Mid Career (3-7 years) | $75,202 |
| Experienced (7+ years) | $121,218 |
Estimates based on BLS percentile data averaged across Missouri metro areas. Individual pay varies by employer, certifications, and specialization.
All 33 Cities in Missouri
| # | City | Median Salary |
|---|---|---|
| 1 | St. Louis | $78,940 |
| 2 | Kansas City | $78,069 |
| 3 | St. Joseph | $70,011 |
| 4 | Independence | $67,772 |
| 5 | St. Peters | $67,277 |
| 6 | St. Charles | $67,151 |
| 7 | Cape Girardeau | $66,823 |
| 8 | O'Fallon | $66,371 |
| 9 | Florissant | $66,025 |
| 10 | Joplin | $65,992 |
| 11 | Wildwood | $65,880 |
| 12 | Kirkwood | $65,861 |
| 13 | Lee's Summit | $65,824 |
| 14 | Chesterfield | $65,814 |
| 15 | University City | $65,469 |
| 16 | Liberty | $65,444 |
| 17 | Grandview | $65,330 |
| 18 | Maryland Heights | $65,221 |
| 19 | Blue Springs | $64,484 |
| 20 | Raytown | $64,099 |
| 21 | Webster Groves | $63,779 |
| 22 | Sedalia | $63,759 |
| 23 | Ballwin | $63,644 |
| 24 | Nixa | $63,639 |
| 25 | Gladstone | $63,469 |
| 26 | Wentzville | $63,320 |
| 27 | Springfield | $62,958 |
| 28 | Belton | $62,785 |
| 29 | Branson | $61,711 |
| 30 | Raymore | $61,476 |
| 31 | Hannibal | $61,277 |
| 32 | Columbia | $59,472 |
| 33 | Jefferson City | $50,809 |
More Missouri Salary Data
Senior / Experienced
Top earner salaries for experienced plumbers.
Compare Cities in Missouri
View all comparisons →Explore More Plumber Salary Data
Frequently Asked Questions
How much do plumbers make in Missouri in 2026?
What is the highest paying city for plumbers in Missouri?
How does Missouri plumber pay compare to the national average?
What is the entry-level plumber salary in Missouri?
How many plumbers are employed in Missouri?
Which Missouri city offers the best value for plumbers?
Written by Samuel Torres, CWP
Career Analyst
Samuel Torres has 10 years of experience in plumbing. He specializes in residential plumbing systems. He has worked with several home improvement companies.
Methodology & Data Source
Statewide salary figures on this page are 2026 projections based on the Bureau of Labor Statistics Occupational Employment and Wage Statistics (OEWS) survey, May 2026 release. A 2.52% compound annual growth rate (CAGR), derived from 6-year national BLS wage trends, was applied to each metro area's reported salary to estimate current 2026 plumber compensation across Missouri. State averages are employment-weighted across 33 metro areas — larger metro areas with more plumberscontribute proportionally more to the average, producing figures that better reflect typical compensation. Individual pay varies by city, employer, certifications, and experience.
Data Sources & Methodology
Source: BLS, OEWS, 7-year dataset (–). Per-city data from annual BLS metropolitan area surveys.
2026 figures are projected from 2025 BLS data using a compound annual growth rate (CAGR) of 2.52%, derived from historical BLS wage trends for plumbers (SOC 47-2152).
Compiled and verified by Samuel Torres, CWP, a licensed plumber with 10+ years of clinical experience. · View source data at BLS.gov