Plumber Salary in Spokane, WA: $74,635 (2026)
Quick Answer:A full-time plumber in Spokane, WA earns a median $74,635/year (≈ $35.88/hour) in nominal terms for 2026 — projected from BLS OEWS 2025 (SOC 47-2152). Once you factor in Spokane's price level (0% above national, BEA RPP 100.3), that paycheck buys what $74,378 would nationally. Nominal pay sits 9.0% below the Washington state average.
Official BLS data · View source
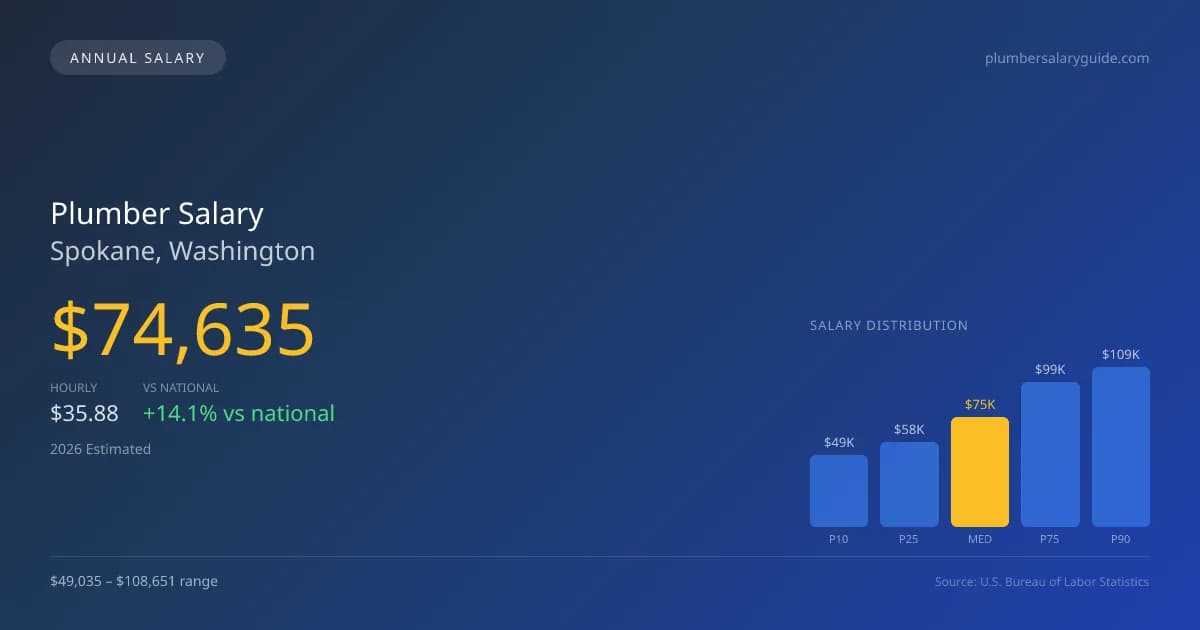
In Spokane, Washington, the 2026 median salary for plumbers is projected at $74,635, reflecting a significant increase over the national median of $65,408, which represents a 14.11% higher rate. The salary range shows a wide spectrum of earnings, with the lowest 10% earning around $49,035 and the top 90% making up to $108,651. These figures, derived from official BLS OEWS surveys, indicate not only the demand for skilled plumbers in the region but also highlight the premium associated with specialty certifications, such as medical gas and industrial plumbing. As the infrastructure ages, the strong earnings potential demonstrates the value placed on certified professionals in Spokane's job market.
Salary Breakdown
| Percentile | Annual | Hourly |
|---|---|---|
| Entry Level (P10) | $49,035 | $23.58 |
| Lower Range (P25) | $57,821 | $27.80 |
| Median (P50)(typical) | $74,635 | $35.88 |
| Upper Range (P75) | $98,675 | $47.44 |
| Top Earners (P90) | $108,651 | $52.23 |
Median Salary Position
14.11% above the national average
2026 Salary Percentile Distribution in Spokane
In Spokane, WA, the plumber salary spread from the 10th to 90th percentile is $59,616 (2026 est.). At $74,635, the local median is 14.11% above the national median of $65,408.
Salary Calculator
At 40 hours/week in Spokane: You'd be in the lower-middle range
How Spokane Plumber Pay Compares
Spokane median: $74,635/year (2026)
| Compared To | Median Salary | Spokane Pays |
|---|---|---|
| Washington Average | $82,016 | -9.00% less |
| National Average | $65,408 | +14.11% more |
Plumbers in Spokane, WA earn a median of $74,635 per year (2026 est.), which is 14.11% higher than the national median of $65,408 and 9.00% below the Washington state average of $82,016.
Cost-of-Living Adjusted Salary
Spokane has a cost of living 0.35% above the national average.
Adjusted salary = nominal × (100 / CoL index). CoL index: 100 = national average.
Spokane, WA has a cost-of-living index of 100.346 (above the national average of 100). While the nominal salary of $74,635 is competitive, the higher cost of living reduces purchasing power to an effective $74,378 — a 0.34% reduction.
Compare Purchasing Power
Select a city to see how your salary compares after cost of living
Select a city above to compare purchasing power
2019 BLS Actual
$52,590
2025 BLS Actual
$72,800
2026 Current Est.
$74,635
2019–2027 Growth
+45.5%
Salary Trajectory for Plumbers in Spokane (2019–2027)
2019–2025: actual BLS OEWS data for this metro area. 2026+: CAGR 2.52% projection.
| Year | Annual Salary | Status |
|---|---|---|
| 2019 | $52,590 | Actual |
| 2020 | $59,620 | Actual |
| 2021 | $60,870 | Actual |
| 2022 | $61,970 | Actual |
| 2023 | $64,840 | Actual |
| 2024 | $74,150 | Actual |
| 2025 | $72,800 | Actual |
| 2026(current) | $74,635 | Estimated |
| 2027 | $76,515 | Projected |
Based on 7 years of BLS OEWS data for the Spokane metropolitan area, the median plumber salary grew 38.4% from $52,590 (2019) to $72,800 (2025). At a 2.52% compound annual growth rate, salaries are projected to reach $76,515 by 2027 — a total increase of $23,925 (45.49%) from 2019.
Note: Historical values (2019–2025) are actual BLS OEWS figures for the Spokane metropolitan area, sourced from annual Occupational Employment and Wage Statistics surveys. 2026–2026 figures are current estimates, and 2027 values are projections, calculated using a 2.52% CAGR derived from 7-year BLS historical data. Actual salaries may vary based on employer, experience, certifications, and local market conditions.
Salary by Experience Level
| Experience | Estimated Salary Range |
|---|---|
| 0-2 years (New Graduate) | $49,035 – $57,821 |
| 3-5 years (Mid Career) | $57,821 – $74,635 |
| 5+ years (Experienced) | $74,635 – $98,675 |
| 10+ years (Top Earner) | $98,675 – $108,651 |
Plumber salary ranges estimated from BLS percentile data. Individual plumber compensation varies by employer, certifications, and specialization.
Plumber Job Market in Spokane
The local employment landscape includes approximately 810 plumbers, showcasing the robust demand for skilled labor in this field. Spokane's cost-of-living index of 100.346 suggests slightly higher living expenses compared to the national average, which can impact overall income and take-home pay. Notably, the highest wages in this area are often found among union contractors, with UA (United Association) members typically earning 30-50% more than their non-union counterparts due to established benefits and job security. Furthermore, specialized roles, like those in medical gas systems, command higher pay due to the expertise required. To maximize earnings, plumbers in Spokane should consider obtaining additional certifications, exploring opportunities in unionized work, and understanding the potential for commission-based income in service roles through companies like Roto-Rooter and ARS / Rescue Rooter, where incentives can substantially increase overall compensation.
More salary data for Spokane, WA:
Frequently Asked Questions
How much do plumbers make in Spokane, WA in 2026?
Is Spokane, WA a good place to work as a plumber?
Can plumbers make $100K in Spokane?
What is the cost-of-living adjusted plumber salary in Spokane?
How much does a plumber make per hour in Spokane?
Related Pages
Compare Salaries
Career Resources
Nearby Cities in Washington
Written by Samuel Torres, CWP
Career Analyst
Samuel Torres has 10 years of experience in plumbing. He specializes in residential plumbing systems. He has worked with several home improvement companies.
Methodology & Data Source
Salary figures on this page are 2026 projections based on the Bureau of Labor Statistics Occupational Employment and Wage Statistics (OEWS) survey, May 2026 release. The BLS reported a median annual salary of $72,800 for plumbersin the Spokane metropolitan area. A 2.52% compound annual growth rate (CAGR), calculated from 6-year national BLS wage trends, was applied to project current 2026 compensation. Percentile ranges (P10–P90) represent the full salary distribution across experience levels and practice settings in this market.
Data Sources & Methodology
Source: BLS, OEWS, 7-year dataset (–). Per-city data from annual BLS metropolitan area surveys.
2026 figures are projected from 2025 BLS data using a compound annual growth rate (CAGR) of 2.52%, derived from historical BLS wage trends for plumbers (SOC 47-2152).
Compiled and verified by Samuel Torres, CWP, a licensed plumber with 10+ years of clinical experience. · View source data at BLS.gov