Plumber Salary in Kennewick, WA: $99,578 (2026)
Quick Answer:A full-time plumber in Kennewick, WA earns a median $99,578/year (≈ $47.88/hour) in nominal terms for 2026 — projected from BLS OEWS 2025 (SOC 47-2152). Once you factor in Kennewick's price level (0% above national, BEA RPP 100.1), that paycheck buys what $99,499 would nationally. Nominal pay sits 21.4% above the Washington state average.
Official BLS data · View source
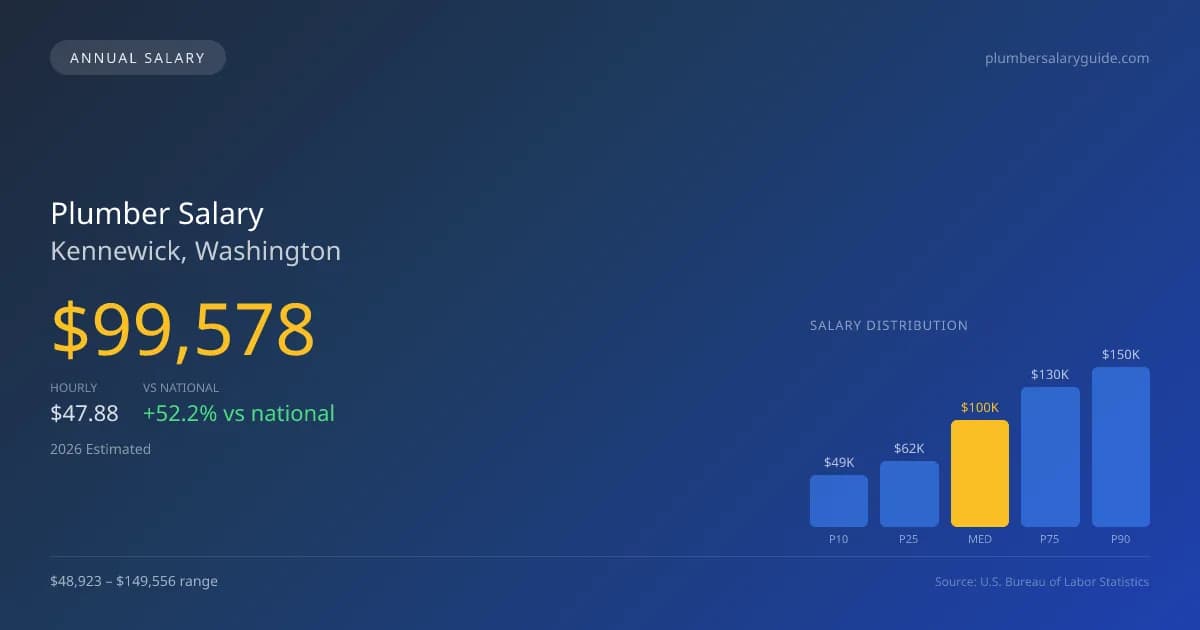
In 2026, plumbers in Kennewick, Washington, are projected to earn a median annual salary of $99,578, significantly higher than the national median of $65,408, indicating a strong local market for this trade. The salary range extends from $48,923 at the 10th percentile to $149,556 at the 90th percentile, suggesting diverse compensation based on experience, skill level, and work type. These figures are derived from 2025 BLS OEWS surveys and reflect the competitive dynamics in Kennewick's plumbing sector. Union pipefitters in particular can command higher wages, typically 30-50% more than their non-union counterparts, which notably influences overall plumber pay in Kennewick WA as the market adapts to demand for skilled professionals in the face of an aging workforce.
Salary Breakdown
| Percentile | Annual | Hourly |
|---|---|---|
| Entry Level (P10) | $48,923 | $23.52 |
| Lower Range (P25) | $62,158 | $29.88 |
| Median (P50)(typical) | $99,578 | $47.88 |
| Upper Range (P75) | $130,416 | $62.70 |
| Top Earners (P90) | $149,556 | $71.90 |
Median Salary Position
52.24% above the national average
2026 Salary Percentile Distribution in Kennewick
In Kennewick, WA, the plumber salary spread from the 10th to 90th percentile is $100,633 (2026 est.). At $99,578, the local median is 52.24% above the national median of $65,408.
Salary Calculator
At 40 hours/week in Kennewick: You'd be above the median
How Kennewick Plumber Pay Compares
Kennewick median: $99,578/year (2026)
| Compared To | Median Salary | Kennewick Pays |
|---|---|---|
| Washington Average | $82,024 | +21.40% more |
| National Average | $65,408 | +52.24% more |
Plumbers in Kennewick, WA earn a median of $99,578 per year (2026 est.), which is 52.24% higher than the national median of $65,408 and 21.40% above the Washington state average of $82,024.
Cost-of-Living Adjusted Salary
Kennewick has a cost of living 0.08% above the national average.
Adjusted salary = nominal × (100 / CoL index). CoL index: 100 = national average.
Kennewick, WA has a cost-of-living index of 100.079 (above the national average of 100). While the nominal salary of $99,578 is competitive, the higher cost of living reduces purchasing power to an effective $99,499 — a 0.08% reduction.
Compare Purchasing Power
Select a city to see how your salary compares after cost of living
Select a city above to compare purchasing power
2019 BLS Actual
$84,360
2025 BLS Actual
$97,130
2026 Current Est.
$99,578
2019–2027 Growth
+21.0%
Salary Trajectory for Plumbers in Kennewick (2019–2027)
2019–2025: actual BLS OEWS data for this metro area. 2026+: CAGR 2.52% projection.
| Year | Annual Salary | Status |
|---|---|---|
| 2019 | $84,360 | Actual |
| 2020 | $87,150 | Actual |
| 2021 | $94,570 | Actual |
| 2022 | $93,380 | Actual |
| 2023 | $97,150 | Actual |
| 2024 | $100,980 | Actual |
| 2025 | $97,130 | Actual |
| 2026(current) | $99,578 | Estimated |
| 2027 | $102,087 | Projected |
Based on 7 years of BLS OEWS data for the Kennewick metropolitan area, the median plumber salary grew 15.1% from $84,360 (2019) to $97,130 (2025). At a 2.52% compound annual growth rate, salaries are projected to reach $102,087 by 2027 — a total increase of $17,727 (21.01%) from 2019.
Note: Historical values (2019–2025) are actual BLS OEWS figures for the Kennewick metropolitan area, sourced from annual Occupational Employment and Wage Statistics surveys. 2026–2026 figures are current estimates, and 2027 values are projections, calculated using a 2.52% CAGR derived from 7-year BLS historical data. Actual salaries may vary based on employer, experience, certifications, and local market conditions.
Salary by Experience Level
| Experience | Estimated Salary Range |
|---|---|
| 0-2 years (New Graduate) | $48,923 – $62,158 |
| 3-5 years (Mid Career) | $62,158 – $99,578 |
| 5+ years (Experienced) | $99,578 – $130,416 |
| 10+ years (Top Earner) | $130,416 – $149,556 |
Plumber salary ranges estimated from BLS percentile data. Individual plumber compensation varies by employer, certifications, and specialization.
Plumber Job Market in Kennewick
With 840 plumbers currently employed in the Kennewick area, the local job market remains robust, supporting a diverse range of plumbing services from residential repairs to industrial maintenance. The cost of living index stands at 100.079, which is slightly above the national average, impacting the purchasing power of local wages. Employers that typically offer the highest pay include union plumbing contractors, large service companies like Roto-Rooter and ARS, and specialized industrial maintenance crews. Factors influencing pay variation include union membership, specialized skills in areas such as medical gas installation, and the potential for earnings through commission structures in service roles. For plumbers in Kennewick, strategies to maximize earnings involve obtaining advanced credentials, such as a master plumber’s license, and seeking specialized training, which can enhance job prospects and pay within this thriving market.
More salary data for Kennewick, WA:
Frequently Asked Questions
How much do plumbers make in Kennewick, WA in 2026?
Is Kennewick, WA a good place to work as a plumber?
Can plumbers make $100K in Kennewick?
What is the cost-of-living adjusted plumber salary in Kennewick?
How much does a plumber make per hour in Kennewick?
Related Pages
Compare Salaries
Career Resources
Nearby Cities in Washington
Written by Samuel Torres, CWP
Career Analyst
Samuel Torres has 10 years of experience in plumbing. He specializes in residential plumbing systems. He has worked with several home improvement companies.
Methodology & Data Source
Salary figures on this page are 2026 projections based on the Bureau of Labor Statistics Occupational Employment and Wage Statistics (OEWS) survey, May 2026 release. The BLS reported a median annual salary of $97,130 for plumbersin the Kennewick metropolitan area. A 2.52% compound annual growth rate (CAGR), calculated from 6-year national BLS wage trends, was applied to project current 2026 compensation. Percentile ranges (P10–P90) represent the full salary distribution across experience levels and practice settings in this market.
Data Sources & Methodology
Source: BLS, OEWS, 7-year dataset (–). Per-city data from annual BLS metropolitan area surveys.
2026 figures are projected from 2025 BLS data using a compound annual growth rate (CAGR) of 2.52%, derived from historical BLS wage trends for plumbers (SOC 47-2152).
Compiled and verified by Samuel Torres, CWP, a licensed plumber with 10+ years of clinical experience. · View source data at BLS.gov