Plumber Salary in Shoreline, WA: $82,295 (2026)
Quick Answer:A full-time plumber in Shoreline, WA earns a median $82,295/year (≈ $39.56/hour) in nominal terms for 2026 — projected from BLS OEWS 2025 (SOC 47-2152). Once you factor in Shoreline's price level (7% above national, BEA RPP 107.4), that paycheck buys what $76,625 would nationally. Nominal pay sits 0.3% above the Washington state average.
Based on BLS state-level estimates · View source
In Shoreline, Washington, the projected median annual plumber salary in 2026 reaches $82,295, significantly above the national median of $65,408. With a salary range spanning from $55,690 at the lower end to $127,557 for high earners, it’s evident that plumbing offers competitive financial prospects in this region. The estimates are derived from 2025 BLS state-level data, adjusted for local economic conditions. The Shoreline market has a notable division between unionized pipefitters, who often command higher wages, and non-union plumbers, which influences overall pay structures. Understanding this divide is crucial for those contemplating a career in plumbing here.
About the Shoreline Market
Salary estimated from Washington average ($82,000) adjusted for local cost of living.
Salary Breakdown
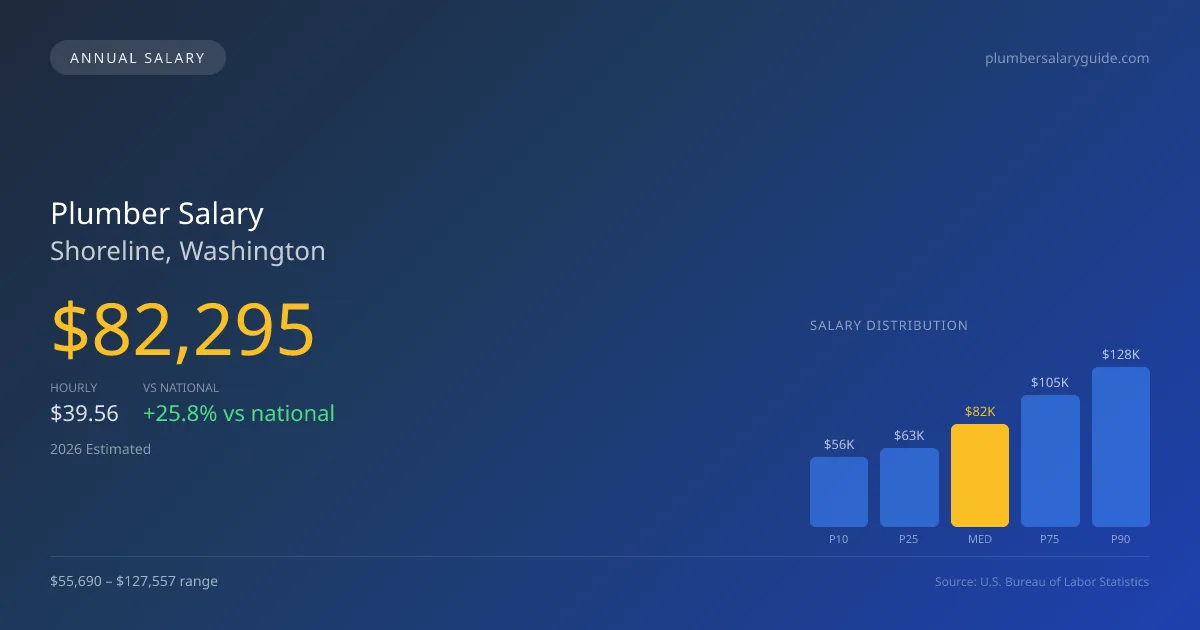
| Percentile | Annual | Hourly |
|---|---|---|
| Entry Level (P10) | $55,690 | $26.78 |
| Lower Range (P25) | $63,179 | $30.38 |
| Median (P50)(typical) | $82,295 | $39.56 |
| Upper Range (P75) | $105,337 | $50.64 |
| Top Earners (P90) | $127,557 | $61.33 |
Median Salary Position
25.82% above the national average
2026 Salary Percentile Distribution in Shoreline
In Shoreline, WA, the plumber salary spread from the 10th to 90th percentile is $71,867 (2026 est.). At $82,295, the local median is 25.82% above the national median of $65,408.
Salary Calculator
At 40 hours/week in Shoreline: You'd be in the lower-middle range
How Shoreline Plumber Pay Compares
Shoreline median: $82,295/year (2026)
| Compared To | Median Salary | Shoreline Pays |
|---|---|---|
| Washington Average | $82,049 | +0.30% more |
| National Average | $65,408 | +25.82% more |
Plumbers in Shoreline, WA earn a median of $82,295 per year (2026 est.), which is 25.82% higher than the national median of $65,408 and 0.30% above the Washington state average of $82,049.
Cost-of-Living Adjusted Salary
Shoreline has a cost of living 7.40% above the national average.
Adjusted salary = nominal × (100 / CoL index). CoL index: 100 = national average.
Shoreline, WA has a cost-of-living index of 107.4 (above the national average of 100). While the nominal salary of $82,295 is competitive, the higher cost of living reduces purchasing power to an effective $76,625 — a 6.89% reduction.
Compare Purchasing Power
Select a city to see how your salary compares after cost of living
Select a city above to compare purchasing power
2019 BLS Actual
$69,401
2025 BLS Actual
$80,272
2026 Current Est.
$82,295
2019–2027 Growth
+21.6%
Salary Trajectory for Plumbers in Shoreline (2019–2027)
2019–2025: actual BLS OEWS data for this metro area. 2026+: CAGR 2.52% projection.
| Year | Annual Salary | Status |
|---|---|---|
| 2019 | $69,401 | Actual |
| 2020 | $70,873 | Actual |
| 2021 | $75,340 | Actual |
| 2022 | $75,604 | Actual |
| 2023 | $77,441 | Actual |
| 2024 | $88,335 | Actual |
| 2025 | $80,272 | Actual |
| 2026(current) | $82,295 | Estimated |
| 2027 | $84,369 | Projected |
Based on 7 years of BLS OEWS data for the Shoreline metropolitan area, the median plumber salary grew 15.7% from $69,401 (2019) to $80,272 (2025). At a 2.52% compound annual growth rate, salaries are projected to reach $84,369 by 2027 — a total increase of $14,968 (21.57%) from 2019.
Note: Historical values (2019–2025) are actual BLS OEWS figures for the Shoreline metropolitan area, sourced from annual Occupational Employment and Wage Statistics surveys. 2026–2026 figures are current estimates, and 2027 values are projections, calculated using a 2.52% CAGR derived from 7-year BLS historical data. Actual salaries may vary based on employer, experience, certifications, and local market conditions.
Salary by Experience Level
| Experience | Estimated Salary Range |
|---|---|
| 0-2 years (New Graduate) | $55,690 – $63,179 |
| 3-5 years (Mid Career) | $63,179 – $82,295 |
| 5+ years (Experienced) | $82,295 – $105,337 |
| 10+ years (Top Earner) | $105,337 – $127,557 |
Plumber salary ranges estimated from BLS percentile data. Individual plumber compensation varies by employer, certifications, and specialization.
Plumber Job Market in Shoreline
The local job market for plumbers in Shoreline is relatively tight, with only eight plumbers currently employed in the area. Despite a higher cost of living index at 107.4, which can affect take-home pay, opportunities remain promising, particularly for those affiliated with union plumbing contractors. Employers such as UA signatories tend to provide salaries that are 30-50% greater compared to their non-union counterparts. This pay disparity is primarily driven by the differing levels of skill specialization—such as medical gas certifications or industrial maintenance expertise—which can also influence earning potential. To maximize earnings in Shoreline, pursuing union apprenticeship programs, obtaining additional certifications, and considering commission-based roles in larger service companies may enhance a plumber's overall income.
More salary data for Shoreline, WA:
Frequently Asked Questions
How much do plumbers make in Shoreline, WA in 2026?
Is Shoreline, WA a good place to work as a plumber?
Can plumbers make $100K in Shoreline?
What is the cost-of-living adjusted plumber salary in Shoreline?
How much does a plumber make per hour in Shoreline?
Related Pages
Compare Salaries
Career Resources
Nearby Cities in Washington
Written by Samuel Torres, CWP
Career Analyst
Samuel Torres has 10 years of experience in plumbing. He specializes in residential plumbing systems. He has worked with several home improvement companies.
Methodology & Data Source
Salary figures on this page are 2026 projections based on the Bureau of Labor Statistics Occupational Employment and Wage Statistics (OEWS) survey, May 2026 release. The BLS reported a median annual salary of $80,272 for plumbersin the Shoreline metropolitan area. A 2.52% compound annual growth rate (CAGR), calculated from 6-year national BLS wage trends, was applied to project current 2026 compensation. Percentile ranges (P10–P90) represent the full salary distribution across experience levels and practice settings in this market.
Data Sources & Methodology
Salary data for Shoreline is estimated from official BLS state-level occupational wage data (2025), adjusted for regional cost-of-living differences using BEA RPP (Regional Price Parities).
2026 figures are projected from 2025 BLS data using a compound annual growth rate (CAGR) of 2.52%, derived from historical BLS wage trends for plumbers (SOC 47-2152).
Compiled and verified by Samuel Torres, CWP, a licensed plumber with 10+ years of clinical experience. · View source data at BLS.gov