Plumber Salary in Richland, WA: $101,653 (2026)
Quick Answer:A full-time plumber in Richland, WA earns a median $101,653/year (≈ $48.87/hour) in nominal terms for 2026 — projected from BLS OEWS 2025 (SOC 47-2152). Once you factor in Richland's price level (7% above national, BEA RPP 107.4), that paycheck buys what $94,649 would nationally. Nominal pay sits 23.9% above the Washington state average.
Based on BLS state-level estimates · View source
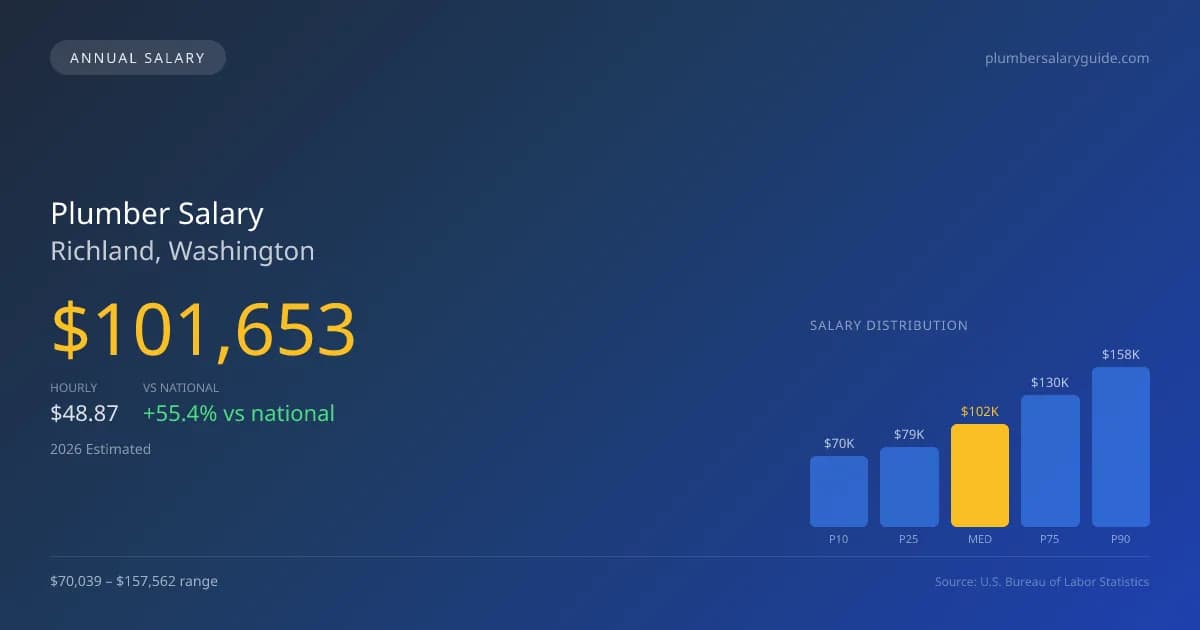
In Richland, Washington, plumbers are well compensated, with a projected median salary of $101,653 in 2026, significantly higher than the national average of $65,408. This compensation reflects the area's demand for skilled plumbing professionals and includes a salary range from $70,039 at the lower end to $157,562 at the upper end. These figures are derived from state-level estimates and take into account the regional price parities of the area. Richland's plumbing market benefits from a mix of high-skilled labor and a critical need for specialties like medical gas certification and industrial plumbing, both of which contribute to the elevated earnings potential for experienced plumbers in the region.
About the Richland Market
Salary estimated from Washington average ($82,000) adjusted for local cost of living.
Salary Breakdown
| Percentile | Annual | Hourly |
|---|---|---|
| Entry Level (P10) | $70,039 | $33.67 |
| Lower Range (P25) | $78,977 | $37.97 |
| Median (P50)(typical) | $101,653 | $48.87 |
| Upper Range (P75) | $130,115 | $62.56 |
| Top Earners (P90) | $157,562 | $75.75 |
Median Salary Position
55.41% above the national average
2026 Salary Percentile Distribution in Richland
In Richland, WA, the plumber salary spread from the 10th to 90th percentile is $87,523 (2026 est.). At $101,653, the local median is 55.41% above the national median of $65,408.
Salary Calculator
At 40 hours/week in Richland: You'd be in the lower-middle range
How Richland Plumber Pay Compares
Richland median: $101,653/year (2026)
| Compared To | Median Salary | Richland Pays |
|---|---|---|
| Washington Average | $82,044 | +23.90% more |
| National Average | $65,408 | +55.41% more |
Plumbers in Richland, WA earn a median of $101,653 per year (2026 est.), which is 55.41% higher than the national median of $65,408 and 23.90% above the Washington state average of $82,044.
Cost-of-Living Adjusted Salary
Richland has a cost of living 7.40% above the national average.
Adjusted salary = nominal × (100 / CoL index). CoL index: 100 = national average.
Richland, WA has a cost-of-living index of 107.4 (above the national average of 100). While the nominal salary of $101,653 is competitive, the higher cost of living reduces purchasing power to an effective $94,649 — a 6.89% reduction.
Compare Purchasing Power
Select a city to see how your salary compares after cost of living
Select a city above to compare purchasing power
2019 BLS Actual
$85,726
2025 BLS Actual
$99,154
2026 Current Est.
$101,653
2019–2027 Growth
+21.6%
Salary Trajectory for Plumbers in Richland (2019–2027)
2019–2025: actual BLS OEWS data for this metro area. 2026+: CAGR 2.52% projection.
| Year | Annual Salary | Status |
|---|---|---|
| 2019 | $85,726 | Actual |
| 2020 | $87,545 | Actual |
| 2021 | $93,062 | Actual |
| 2022 | $93,388 | Actual |
| 2023 | $95,657 | Actual |
| 2024 | $89,004 | Actual |
| 2025 | $99,154 | Actual |
| 2026(current) | $101,653 | Estimated |
| 2027 | $104,214 | Projected |
Based on 7 years of BLS OEWS data for the Richland metropolitan area, the median plumber salary grew 15.7% from $85,726 (2019) to $99,154 (2025). At a 2.52% compound annual growth rate, salaries are projected to reach $104,214 by 2027 — a total increase of $18,488 (21.57%) from 2019.
Note: Historical values (2019–2025) are actual BLS OEWS figures for the Richland metropolitan area, sourced from annual Occupational Employment and Wage Statistics surveys. 2026–2026 figures are current estimates, and 2027 values are projections, calculated using a 2.52% CAGR derived from 7-year BLS historical data. Actual salaries may vary based on employer, experience, certifications, and local market conditions.
Salary by Experience Level
| Experience | Estimated Salary Range |
|---|---|
| 0-2 years (New Graduate) | $70,039 – $78,977 |
| 3-5 years (Mid Career) | $78,977 – $101,653 |
| 5+ years (Experienced) | $101,653 – $130,115 |
| 10+ years (Top Earner) | $130,115 – $157,562 |
Plumber salary ranges estimated from BLS percentile data. Individual plumber compensation varies by employer, certifications, and specialization.
Plumber Job Market in Richland
With 15 plumbers currently employed in Richland, the local job market demonstrates both stability and opportunity; however, the 107.4 cost of living index indicates that expenses may be above the national average. This higher cost of living impacts take-home purchasing power, making it essential for plumbers to maximize their income to match local demands. Those employed by union contractors, particularly in pipefitting roles, can expect compensation 30-50% higher than non-union counterparts, especially for specialties that require additional certifications like medical gas and backflow prevention. Additionally, plumbers working for reputable service firms such as Roto-Rooter may find variable but potentially lucrative commissions, while self-employed professionals can set their own rates, enhancing their earning capabilities. The spread in pay can often be traced to experience levels, licensing credentials, and the demand for various plumbing services across sectors, from residential to industrial. Understanding these dynamics is key for anyone looking to improve their plumber pay in Richland, WA.
More salary data for Richland, WA:
Frequently Asked Questions
How much do plumbers make in Richland, WA in 2026?
Is Richland, WA a good place to work as a plumber?
Can plumbers make $100K in Richland?
What is the cost-of-living adjusted plumber salary in Richland?
How much does a plumber make per hour in Richland?
Related Pages
Compare Salaries
Career Resources
Nearby Cities in Washington
Written by Samuel Torres, CWP
Career Analyst
Samuel Torres has 10 years of experience in plumbing. He specializes in residential plumbing systems. He has worked with several home improvement companies.
Methodology & Data Source
Salary figures on this page are 2026 projections based on the Bureau of Labor Statistics Occupational Employment and Wage Statistics (OEWS) survey, May 2026 release. The BLS reported a median annual salary of $99,154 for plumbersin the Richland metropolitan area. A 2.52% compound annual growth rate (CAGR), calculated from 6-year national BLS wage trends, was applied to project current 2026 compensation. Percentile ranges (P10–P90) represent the full salary distribution across experience levels and practice settings in this market.
Data Sources & Methodology
Salary data for Richland is estimated from official BLS state-level occupational wage data (2025), adjusted for regional cost-of-living differences using BEA RPP (Regional Price Parities).
2026 figures are projected from 2025 BLS data using a compound annual growth rate (CAGR) of 2.52%, derived from historical BLS wage trends for plumbers (SOC 47-2152).
Compiled and verified by Samuel Torres, CWP, a licensed plumber with 10+ years of clinical experience. · View source data at BLS.gov