Plumber Salary in Redmond, WA: $81,970 (2026)
Quick Answer:A full-time plumber in Redmond, WA earns a median $81,970/year (≈ $39.41/hour) in nominal terms for 2026 — projected from BLS OEWS 2025 (SOC 47-2152). Once you factor in Redmond's price level (7% above national, BEA RPP 107.4), that paycheck buys what $76,322 would nationally. Nominal pay sits 0.1% below the Washington state average.
Based on BLS state-level estimates · View source
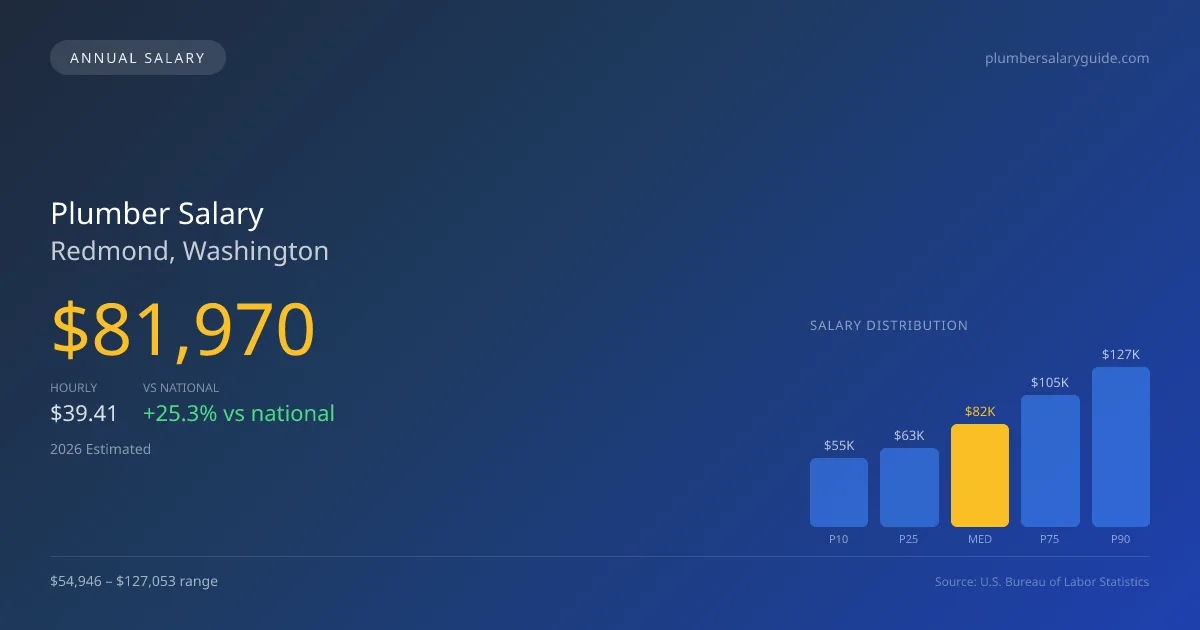
With a projected 2026 median annual salary of $81,970, plumbers in Redmond, WA, can earn significantly more than the national median of $65,408, reflecting a premium of 25.32%. This salary range spans from $54,946 at the 10th percentile to as high as $127,053 at the 90th percentile, illustrating the diverse earning potential within the profession. These estimates, derived from 2025 BLS data and adjusted for regional cost differences, highlight the choice many plumbers face between collaborating with established contractors or operating as self-employed professionals. The tight labor market for plumbing services in Redmond reveals a strong demand, enabling seasoned workers and skilled tradespeople to command higher wages.
About the Redmond Market
Salary estimated from Washington average ($82,000) adjusted for local cost of living.
Salary Breakdown
| Percentile | Annual | Hourly |
|---|---|---|
| Entry Level (P10) | $54,946 | $26.42 |
| Lower Range (P25) | $62,536 | $30.07 |
| Median (P50)(typical) | $81,970 | $39.41 |
| Upper Range (P75) | $104,921 | $50.44 |
| Top Earners (P90) | $127,053 | $61.08 |
Median Salary Position
25.32% above the national average
2026 Salary Percentile Distribution in Redmond
In Redmond, WA, the plumber salary spread from the 10th to 90th percentile is $72,107 (2026 est.). At $81,970, the local median is 25.32% above the national median of $65,408.
Salary Calculator
At 40 hours/week in Redmond: You'd be in the lower-middle range
How Redmond Plumber Pay Compares
Redmond median: $81,970/year (2026)
| Compared To | Median Salary | Redmond Pays |
|---|---|---|
| Washington Average | $82,052 | -0.10% less |
| National Average | $65,408 | +25.32% more |
Plumbers in Redmond, WA earn a median of $81,970 per year (2026 est.), which is 25.32% higher than the national median of $65,408 and 0.10% below the Washington state average of $82,052.
Cost-of-Living Adjusted Salary
Redmond has a cost of living 7.40% above the national average.
Adjusted salary = nominal × (100 / CoL index). CoL index: 100 = national average.
Redmond, WA has a cost-of-living index of 107.4 (above the national average of 100). While the nominal salary of $81,970 is competitive, the higher cost of living reduces purchasing power to an effective $76,322 — a 6.89% reduction.
Compare Purchasing Power
Select a city to see how your salary compares after cost of living
Select a city above to compare purchasing power
2019 BLS Actual
$69,127
2025 BLS Actual
$79,955
2026 Current Est.
$81,970
2019–2027 Growth
+21.6%
Salary Trajectory for Plumbers in Redmond (2019–2027)
2019–2025: actual BLS OEWS data for this metro area. 2026+: CAGR 2.52% projection.
| Year | Annual Salary | Status |
|---|---|---|
| 2019 | $69,127 | Actual |
| 2020 | $70,593 | Actual |
| 2021 | $75,042 | Actual |
| 2022 | $75,306 | Actual |
| 2023 | $77,135 | Actual |
| 2024 | $87,986 | Actual |
| 2025 | $79,955 | Actual |
| 2026(current) | $81,970 | Estimated |
| 2027 | $84,036 | Projected |
Based on 7 years of BLS OEWS data for the Redmond metropolitan area, the median plumber salary grew 15.7% from $69,127 (2019) to $79,955 (2025). At a 2.52% compound annual growth rate, salaries are projected to reach $84,036 by 2027 — a total increase of $14,909 (21.57%) from 2019.
Note: Historical values (2019–2025) are actual BLS OEWS figures for the Redmond metropolitan area, sourced from annual Occupational Employment and Wage Statistics surveys. 2026–2026 figures are current estimates, and 2027 values are projections, calculated using a 2.52% CAGR derived from 7-year BLS historical data. Actual salaries may vary based on employer, experience, certifications, and local market conditions.
Salary by Experience Level
| Experience | Estimated Salary Range |
|---|---|
| 0-2 years (New Graduate) | $54,946 – $62,536 |
| 3-5 years (Mid Career) | $62,536 – $81,970 |
| 5+ years (Experienced) | $81,970 – $104,921 |
| 10+ years (Top Earner) | $104,921 – $127,053 |
Plumber salary ranges estimated from BLS percentile data. Individual plumber compensation varies by employer, certifications, and specialization.
Plumber Job Market in Redmond
As of 2025, only 14 plumbers are currently employed in the area, indicating a competitive job environment where opportunities may be limited but lucrative. The cost of living index in Redmond stands at 107.4, meaning that while pay is relatively high, living expenses are also elevated. Plumbers working for union contractors, like the UA, often see higher wages than their non-union counterparts, with industrial maintenance roles typically offering the best compensation. Those specializing in medical gas or other advanced skills may further enhance their earnings. To maximize their pay, plumbers should consider acquiring additional credentials, like a master license for contracting or focusing on in-demand specialties, while also leveraging commission structures offered by larger service companies to boost income. Understanding these dynamics will be key for plumbers aiming to enhance their financial standing in Redmond.
More salary data for Redmond, WA:
Frequently Asked Questions
How much do plumbers make in Redmond, WA in 2026?
Is Redmond, WA a good place to work as a plumber?
Can plumbers make $100K in Redmond?
What is the cost-of-living adjusted plumber salary in Redmond?
How much does a plumber make per hour in Redmond?
Related Pages
Compare Salaries
Career Resources
Nearby Cities in Washington
Written by Samuel Torres, CWP
Career Analyst
Samuel Torres has 10 years of experience in plumbing. He specializes in residential plumbing systems. He has worked with several home improvement companies.
Methodology & Data Source
Salary figures on this page are 2026 projections based on the Bureau of Labor Statistics Occupational Employment and Wage Statistics (OEWS) survey, May 2026 release. The BLS reported a median annual salary of $79,955 for plumbersin the Redmond metropolitan area. A 2.52% compound annual growth rate (CAGR), calculated from 6-year national BLS wage trends, was applied to project current 2026 compensation. Percentile ranges (P10–P90) represent the full salary distribution across experience levels and practice settings in this market.
Data Sources & Methodology
Salary data for Redmond is estimated from official BLS state-level occupational wage data (2025), adjusted for regional cost-of-living differences using BEA RPP (Regional Price Parities).
2026 figures are projected from 2025 BLS data using a compound annual growth rate (CAGR) of 2.52%, derived from historical BLS wage trends for plumbers (SOC 47-2152).
Compiled and verified by Samuel Torres, CWP, a licensed plumber with 10+ years of clinical experience. · View source data at BLS.gov