Plumber Salary in Mount Vernon, WA: $79,494 (2026)
Quick Answer:A full-time plumber in Mount Vernon, WA earns a median $79,494/year (≈ $38.22/hour) in nominal terms for 2026 — projected from BLS OEWS 2025 (SOC 47-2152). Once you factor in Mount Vernon's price level (2% above national, BEA RPP 102.4), that paycheck buys what $77,598 would nationally. Nominal pay sits 3.1% below the Washington state average.
Official BLS data · View source
In 2026, plumbers working in Mount Vernon, WA, can expect a median annual salary of $79,494, significantly above the national median of $65,408. The salary range reflects varying levels of experience and specialization, with entry-level positions starting around $50,050 and experienced plumbers earning as much as $122,101. These figures are drawn from projections based on 2025 BLS OEWS data, showcasing the financial potential for both employed service plumbers and self-employed contractors in the area. The robust job market and competitive pay underscore the value of skilled trades, especially in a region where plumbing demands continue to grow due to aging infrastructure.
Salary Breakdown
| Percentile | Annual | Hourly |
|---|---|---|
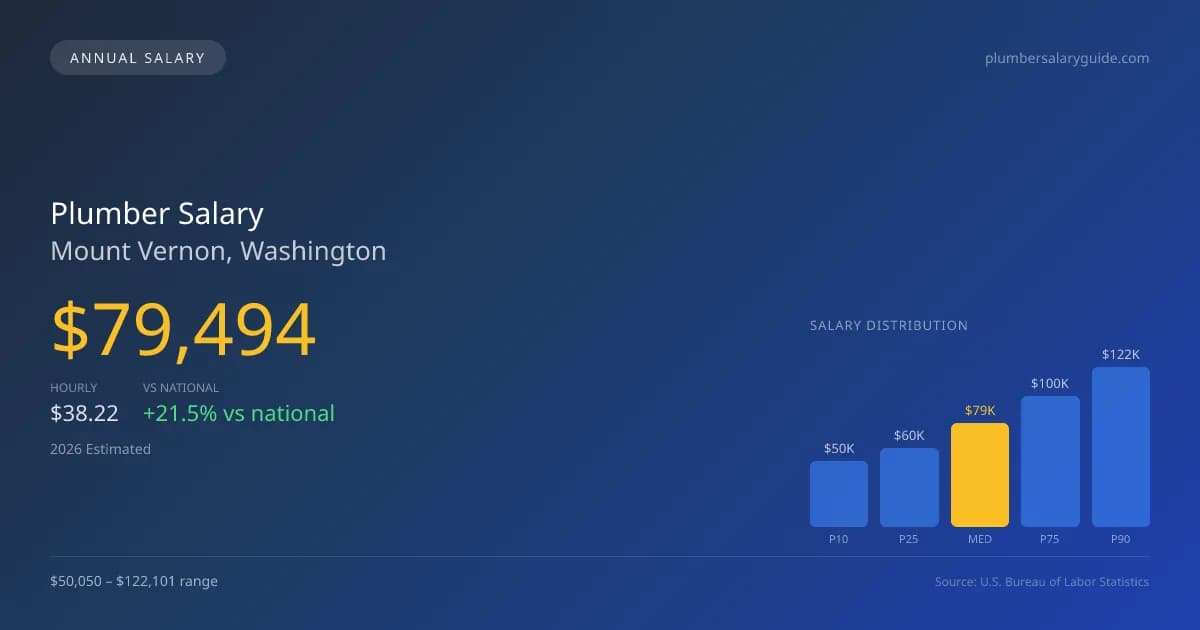
| Entry Level (P10) | $50,050 | $24.06 |
| Lower Range (P25) | $60,343 | $29.01 |
| Median (P50)(typical) | $79,494 | $38.22 |
| Upper Range (P75) | $99,916 | $48.03 |
| Top Earners (P90) | $122,101 | $58.70 |
Median Salary Position
21.54% above the national average
2026 Salary Percentile Distribution in Mount Vernon
In Mount Vernon, WA, the plumber salary spread from the 10th to 90th percentile is $72,051 (2026 est.). At $79,494, the local median is 21.54% above the national median of $65,408.
Salary Calculator
At 40 hours/week in Mount Vernon: You'd be in the lower-middle range
How Mount Vernon Plumber Pay Compares
Mount Vernon median: $79,494/year (2026)
| Compared To | Median Salary | Mount Vernon Pays |
|---|---|---|
| Washington Average | $82,037 | -3.10% less |
| National Average | $65,408 | +21.54% more |
Plumbers in Mount Vernon, WA earn a median of $79,494 per year (2026 est.), which is 21.54% higher than the national median of $65,408 and 3.10% below the Washington state average of $82,037.
Cost-of-Living Adjusted Salary
Mount Vernon has a cost of living 2.44% above the national average.
Adjusted salary = nominal × (100 / CoL index). CoL index: 100 = national average.
Mount Vernon, WA has a cost-of-living index of 102.443 (above the national average of 100). While the nominal salary of $79,494 is competitive, the higher cost of living reduces purchasing power to an effective $77,598 — a 2.39% reduction.
Compare Purchasing Power
Select a city to see how your salary compares after cost of living
Select a city above to compare purchasing power
2019 BLS Actual
$64,870
2025 BLS Actual
$77,540
2026 Current Est.
$79,494
2019–2027 Growth
+25.6%
Salary Trajectory for Plumbers in Mount Vernon (2019–2027)
2019–2025: actual BLS OEWS data for this metro area. 2026+: CAGR 2.52% projection.
| Year | Annual Salary | Status |
|---|---|---|
| 2019 | $64,870 | Actual |
| 2020 | $62,660 | Actual |
| 2021 | $61,570 | Actual |
| 2022 | $62,920 | Actual |
| 2023 | $66,850 | Actual |
| 2024 | $76,810 | Actual |
| 2025 | $77,540 | Actual |
| 2026(current) | $79,494 | Estimated |
| 2027 | $81,497 | Projected |
Based on 7 years of BLS OEWS data for the Mount Vernon metropolitan area, the median plumber salary grew 19.5% from $64,870 (2019) to $77,540 (2025). At a 2.52% compound annual growth rate, salaries are projected to reach $81,497 by 2027 — a total increase of $16,627 (25.63%) from 2019.
Note: Historical values (2019–2025) are actual BLS OEWS figures for the Mount Vernon metropolitan area, sourced from annual Occupational Employment and Wage Statistics surveys. 2026–2026 figures are current estimates, and 2027 values are projections, calculated using a 2.52% CAGR derived from 7-year BLS historical data. Actual salaries may vary based on employer, experience, certifications, and local market conditions.
Salary by Experience Level
| Experience | Estimated Salary Range |
|---|---|
| 0-2 years (New Graduate) | $50,050 – $60,343 |
| 3-5 years (Mid Career) | $60,343 – $79,494 |
| 5+ years (Experienced) | $79,494 – $99,916 |
| 10+ years (Top Earner) | $99,916 – $122,101 |
Plumber salary ranges estimated from BLS percentile data. Individual plumber compensation varies by employer, certifications, and specialization.
Plumber Job Market in Mount Vernon
The local job market is bolstered by approximately 230 plumbers currently employed in Mount Vernon, contributing to a diverse range of opportunities. A cost-of-living index of 102.443 indicates a slightly higher living expense than the national average, which directly influences take-home purchasing power for plumbers. Among employers, union plumbing contractors, particularly those affiliated with the United Association, typically offer higher wages compared to non-union and self-employed positions, with pipefitter and steamfitter wages leading the pay scale. The variations in plumber pay in Mount Vernon stem from factors such as specialty skills in medical gas or backflow prevention, commission structures within large service companies, and the premium associated with licenses and certifications. For those looking to maximize their income, pursuing additional qualifications and connecting with union networks could be effective strategies in this thriving market.
More salary data for Mount Vernon, WA:
Frequently Asked Questions
How much do plumbers make in Mount Vernon, WA in 2026?
Is Mount Vernon, WA a good place to work as a plumber?
Can plumbers make $100K in Mount Vernon?
What is the cost-of-living adjusted plumber salary in Mount Vernon?
How much does a plumber make per hour in Mount Vernon?
Related Pages
Compare Salaries
Career Resources
Nearby Cities in Washington
Written by Samuel Torres, CWP
Career Analyst
Samuel Torres has 10 years of experience in plumbing. He specializes in residential plumbing systems. He has worked with several home improvement companies.
Methodology & Data Source
Salary figures on this page are 2026 projections based on the Bureau of Labor Statistics Occupational Employment and Wage Statistics (OEWS) survey, May 2026 release. The BLS reported a median annual salary of $77,540 for plumbersin the Mount Vernon metropolitan area. A 2.52% compound annual growth rate (CAGR), calculated from 6-year national BLS wage trends, was applied to project current 2026 compensation. Percentile ranges (P10–P90) represent the full salary distribution across experience levels and practice settings in this market.
Data Sources & Methodology
Source: BLS, OEWS, 7-year dataset (–). Per-city data from annual BLS metropolitan area surveys.
2026 figures are projected from 2025 BLS data using a compound annual growth rate (CAGR) of 2.52%, derived from historical BLS wage trends for plumbers (SOC 47-2152).
Compiled and verified by Samuel Torres, CWP, a licensed plumber with 10+ years of clinical experience. · View source data at BLS.gov