Plumber Salary in Maple Valley, WA: $78,055 (2026)
Quick Answer:A full-time plumber in Maple Valley, WA earns a median $78,055/year (≈ $37.52/hour) in nominal terms for 2026 — projected from BLS OEWS 2025 (SOC 47-2152). Once you factor in Maple Valley's price level (7% above national, BEA RPP 107.4), that paycheck buys what $72,677 would nationally. Nominal pay sits 4.9% below the Washington state average.
Based on BLS state-level estimates · View source
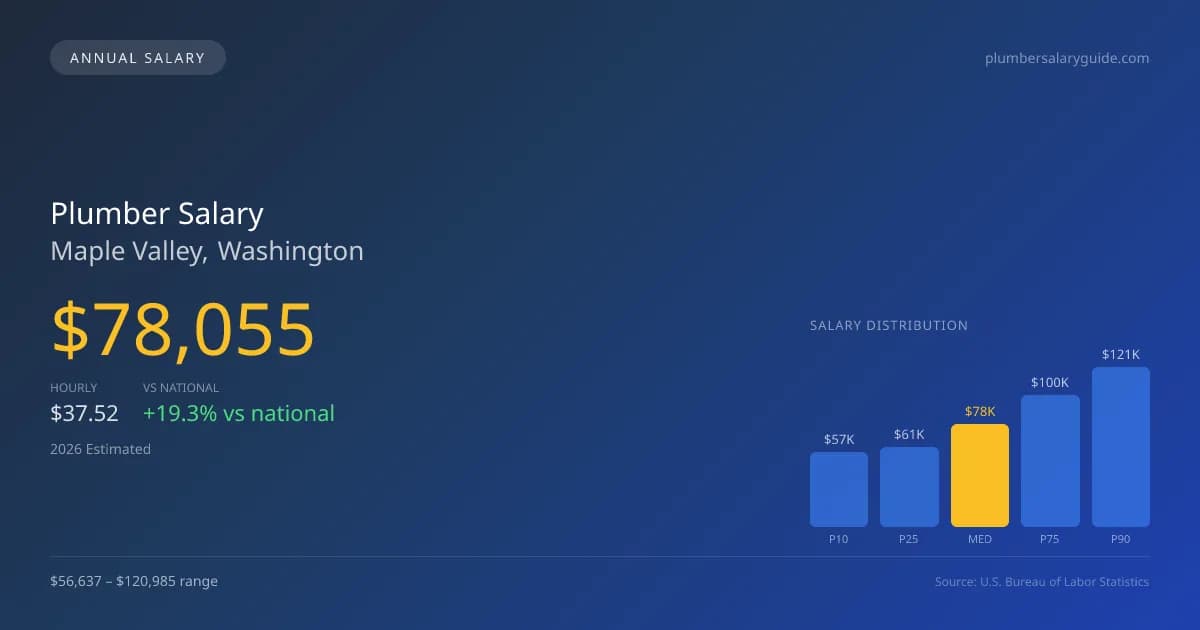
In 2026, the projected median annual salary for plumbers in Maple Valley, Washington, is $78,055, which is 19.34% higher than the national median of $65,408. The local compensation varies significantly, with salaries ranging from $56,637 at the 10th percentile to as high as $120,985 at the 90th percentile. These figures, derived from 2025 BLS data projected for 2026, reflect the local market dynamics, including the presence of both self-employed contractors and employed plumbers within service companies. While self-employed plumbers may enjoy the flexibility of choosing projects and setting rates, employed plumbers benefit from job stability and often receive additional benefits. Given the relatively low number of plumbers, with only six currently employed in Maple Valley, those entering the industry can anticipate a competitive job market reliant on individual specialties and credentials.
About the Maple Valley Market
Salary estimated from Washington average ($82,000) adjusted for local cost of living.
Salary Breakdown
| Percentile | Annual | Hourly |
|---|---|---|
| Entry Level (P10) | $56,637 | $27.23 |
| Lower Range (P25) | $60,783 | $29.22 |
| Median (P50)(typical) | $78,055 | $37.52 |
| Upper Range (P75) | $99,910 | $48.03 |
| Top Earners (P90) | $120,985 | $58.17 |
Median Salary Position
19.34% above the national average
2026 Salary Percentile Distribution in Maple Valley
In Maple Valley, WA, the plumber salary spread from the 10th to 90th percentile is $64,348 (2026 est.). At $78,055, the local median is 19.34% above the national median of $65,408.
Salary Calculator
At 40 hours/week in Maple Valley: You'd be in the lower-middle range
How Maple Valley Plumber Pay Compares
Maple Valley median: $78,055/year (2026)
| Compared To | Median Salary | Maple Valley Pays |
|---|---|---|
| Washington Average | $82,076 | -4.90% less |
| National Average | $65,408 | +19.34% more |
Plumbers in Maple Valley, WA earn a median of $78,055 per year (2026 est.), which is 19.34% higher than the national median of $65,408 and 4.90% below the Washington state average of $82,076.
Cost-of-Living Adjusted Salary
Maple Valley has a cost of living 7.40% above the national average.
Adjusted salary = nominal × (100 / CoL index). CoL index: 100 = national average.
Maple Valley, WA has a cost-of-living index of 107.4 (above the national average of 100). While the nominal salary of $78,055 is competitive, the higher cost of living reduces purchasing power to an effective $72,677 — a 6.89% reduction.
Compare Purchasing Power
Select a city to see how your salary compares after cost of living
Select a city above to compare purchasing power
2019 BLS Actual
$65,825
2025 BLS Actual
$76,136
2026 Current Est.
$78,055
2019–2027 Growth
+21.6%
Salary Trajectory for Plumbers in Maple Valley (2019–2027)
2019–2025: actual BLS OEWS data for this metro area. 2026+: CAGR 2.52% projection.
| Year | Annual Salary | Status |
|---|---|---|
| 2019 | $65,825 | Actual |
| 2020 | $67,222 | Actual |
| 2021 | $71,458 | Actual |
| 2022 | $71,709 | Actual |
| 2023 | $73,451 | Actual |
| 2024 | $83,782 | Actual |
| 2025 | $76,136 | Actual |
| 2026(current) | $78,055 | Estimated |
| 2027 | $80,022 | Projected |
Based on 7 years of BLS OEWS data for the Maple Valley metropolitan area, the median plumber salary grew 15.7% from $65,825 (2019) to $76,136 (2025). At a 2.52% compound annual growth rate, salaries are projected to reach $80,022 by 2027 — a total increase of $14,197 (21.57%) from 2019.
Note: Historical values (2019–2025) are actual BLS OEWS figures for the Maple Valley metropolitan area, sourced from annual Occupational Employment and Wage Statistics surveys. 2026–2026 figures are current estimates, and 2027 values are projections, calculated using a 2.52% CAGR derived from 7-year BLS historical data. Actual salaries may vary based on employer, experience, certifications, and local market conditions.
Salary by Experience Level
| Experience | Estimated Salary Range |
|---|---|
| 0-2 years (New Graduate) | $56,637 – $60,783 |
| 3-5 years (Mid Career) | $60,783 – $78,055 |
| 5+ years (Experienced) | $78,055 – $99,910 |
| 10+ years (Top Earner) | $99,910 – $120,985 |
Plumber salary ranges estimated from BLS percentile data. Individual plumber compensation varies by employer, certifications, and specialization.
Plumber Job Market in Maple Valley
When analyzing plumber pay in Maple Valley, it’s crucial to consider the cost of living, which stands at a slight premium with an index of 107.4. This adjustment impacts the overall purchasing power of plumbers’ salaries in the area, making the distinction between union and non-union positions particularly significant. Union pipefitters affiliated with the UA typically secure salaries 30-50% higher than their non-union counterparts, emphasizing the value of union membership for maximizing earnings. Additionally, specialty certifications in medical gas or backflow prevention can command higher wages, while service plumbing positions often involve commission structures that can lead to variable income. For those looking to increase their pay in this market, seeking licensing for both journeyman and contractor roles, gaining experience in high-demand specialties, and considering roles with larger service companies or municipal utilities may prove advantageous, given the ongoing need for skilled professionals in a rapidly evolving industry landscape.
More salary data for Maple Valley, WA:
Frequently Asked Questions
How much do plumbers make in Maple Valley, WA in 2026?
Is Maple Valley, WA a good place to work as a plumber?
Can plumbers make $100K in Maple Valley?
What is the cost-of-living adjusted plumber salary in Maple Valley?
How much does a plumber make per hour in Maple Valley?
Related Pages
Compare Salaries
Career Resources
Nearby Cities in Washington
Written by Samuel Torres, CWP
Career Analyst
Samuel Torres has 10 years of experience in plumbing. He specializes in residential plumbing systems. He has worked with several home improvement companies.
Methodology & Data Source
Salary figures on this page are 2026 projections based on the Bureau of Labor Statistics Occupational Employment and Wage Statistics (OEWS) survey, May 2026 release. The BLS reported a median annual salary of $76,136 for plumbersin the Maple Valley metropolitan area. A 2.52% compound annual growth rate (CAGR), calculated from 6-year national BLS wage trends, was applied to project current 2026 compensation. Percentile ranges (P10–P90) represent the full salary distribution across experience levels and practice settings in this market.
Data Sources & Methodology
Salary data for Maple Valley is estimated from official BLS state-level occupational wage data (2025), adjusted for regional cost-of-living differences using BEA RPP (Regional Price Parities).
2026 figures are projected from 2025 BLS data using a compound annual growth rate (CAGR) of 2.52%, derived from historical BLS wage trends for plumbers (SOC 47-2152).
Compiled and verified by Samuel Torres, CWP, a licensed plumber with 10+ years of clinical experience. · View source data at BLS.gov