Plumber Salary in Kirkland, WA: $81,769 (2026)
Quick Answer:A full-time plumber in Kirkland, WA earns a median $81,769/year (≈ $39.32/hour) in nominal terms for 2026 — projected from BLS OEWS 2025 (SOC 47-2152). Once you factor in Kirkland's price level (7% above national, BEA RPP 107.4), that paycheck buys what $76,135 would nationally. Nominal pay sits 0.3% below the Washington state average.
Based on BLS state-level estimates · View source
In 2026, plumbers in Kirkland, Washington, can expect a median annual salary of $81,769, which reflects a 25.01% premium over the national median of $65,408. The salary range for the profession is significant, spanning from $54,402 at the 10th percentile to $126,741 for those at the 90th percentile. These figures are based on estimates derived from 2025 BLS data, adjusted for the region's unique cost-of-living considerations. For plumbers with specialized skills, such as medical gas or industrial licensing, the potential for increased earnings is substantial, creating competitive opportunities within Kirkland's job market.
About the Kirkland Market
Salary estimated from Washington average ($82,000) adjusted for local cost of living.
Salary Breakdown
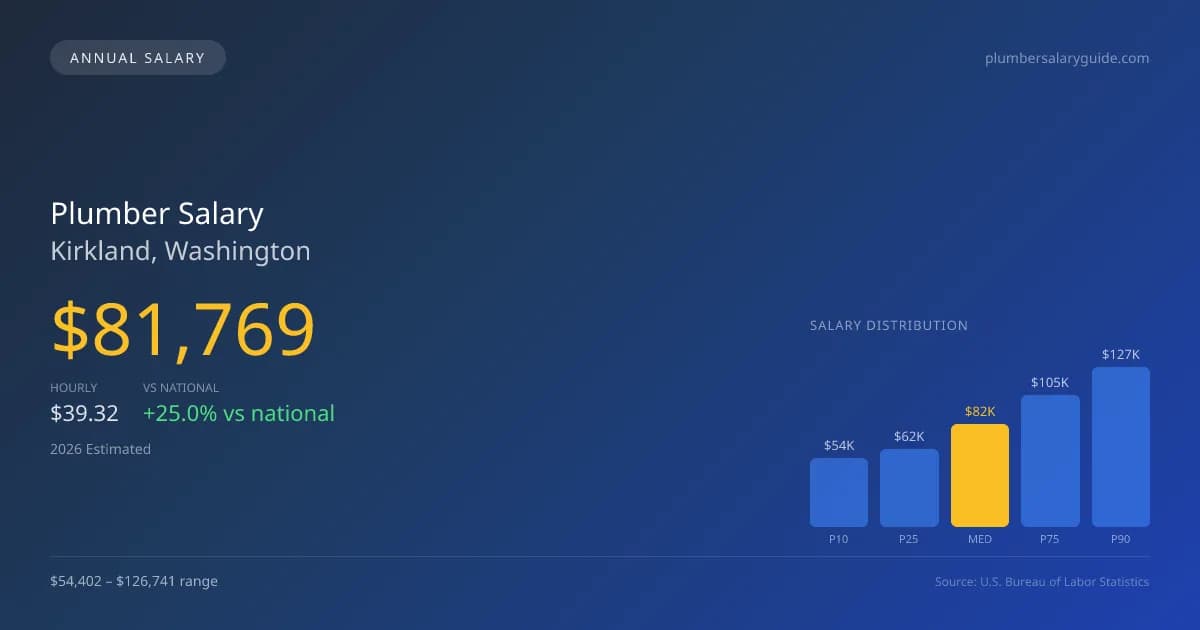
| Percentile | Annual | Hourly |
|---|---|---|
| Entry Level (P10) | $54,402 | $26.15 |
| Lower Range (P25) | $62,139 | $29.87 |
| Median (P50)(typical) | $81,769 | $39.32 |
| Upper Range (P75) | $104,665 | $50.32 |
| Top Earners (P90) | $126,741 | $60.94 |
Median Salary Position
25.01% above the national average
2026 Salary Percentile Distribution in Kirkland
In Kirkland, WA, the plumber salary spread from the 10th to 90th percentile is $72,339 (2026 est.). At $81,769, the local median is 25.01% above the national median of $65,408.
Salary Calculator
At 40 hours/week in Kirkland: You'd be in the lower-middle range
How Kirkland Plumber Pay Compares
Kirkland median: $81,769/year (2026)
| Compared To | Median Salary | Kirkland Pays |
|---|---|---|
| Washington Average | $82,015 | -0.30% less |
| National Average | $65,408 | +25.01% more |
Plumbers in Kirkland, WA earn a median of $81,769 per year (2026 est.), which is 25.01% higher than the national median of $65,408 and 0.30% below the Washington state average of $82,015.
Cost-of-Living Adjusted Salary
Kirkland has a cost of living 7.40% above the national average.
Adjusted salary = nominal × (100 / CoL index). CoL index: 100 = national average.
Kirkland, WA has a cost-of-living index of 107.4 (above the national average of 100). While the nominal salary of $81,769 is competitive, the higher cost of living reduces purchasing power to an effective $76,135 — a 6.89% reduction.
Compare Purchasing Power
Select a city to see how your salary compares after cost of living
Select a city above to compare purchasing power
2019 BLS Actual
$68,958
2025 BLS Actual
$79,759
2026 Current Est.
$81,769
2019–2027 Growth
+21.6%
Salary Trajectory for Plumbers in Kirkland (2019–2027)
2019–2025: actual BLS OEWS data for this metro area. 2026+: CAGR 2.52% projection.
| Year | Annual Salary | Status |
|---|---|---|
| 2019 | $68,958 | Actual |
| 2020 | $70,420 | Actual |
| 2021 | $74,858 | Actual |
| 2022 | $75,121 | Actual |
| 2023 | $76,946 | Actual |
| 2024 | $87,770 | Actual |
| 2025 | $79,759 | Actual |
| 2026(current) | $81,769 | Estimated |
| 2027 | $83,830 | Projected |
Based on 7 years of BLS OEWS data for the Kirkland metropolitan area, the median plumber salary grew 15.7% from $68,958 (2019) to $79,759 (2025). At a 2.52% compound annual growth rate, salaries are projected to reach $83,830 by 2027 — a total increase of $14,872 (21.57%) from 2019.
Note: Historical values (2019–2025) are actual BLS OEWS figures for the Kirkland metropolitan area, sourced from annual Occupational Employment and Wage Statistics surveys. 2026–2026 figures are current estimates, and 2027 values are projections, calculated using a 2.52% CAGR derived from 7-year BLS historical data. Actual salaries may vary based on employer, experience, certifications, and local market conditions.
Salary by Experience Level
| Experience | Estimated Salary Range |
|---|---|
| 0-2 years (New Graduate) | $54,402 – $62,139 |
| 3-5 years (Mid Career) | $62,139 – $81,769 |
| 5+ years (Experienced) | $81,769 – $104,665 |
| 10+ years (Top Earner) | $104,665 – $126,741 |
Plumber salary ranges estimated from BLS percentile data. Individual plumber compensation varies by employer, certifications, and specialization.
Plumber Job Market in Kirkland
With only 13 plumbers currently employed in the Kirkland area, the job market remains tight, contributing to higher average income levels amidst a cost-of-living index of 107.4, indicating a slightly elevated living expense compared to the national average. Employers such as union plumbing contractors, self-employed solo plumbers, and large service companies like Roto-Rooter offer varying salary structures, with union positions typically providing a premium due to collective bargaining agreements. The disparity in pay can also be attributed to factors such as specialization in medical gas, overtime, call-out premiums, and the presence of master licenses. For those looking to maximize their earnings in Kirkland, pursuing union membership, obtaining specialty credentials, and focusing on high-demand areas like service jobs can significantly enhance overall pay potential.
More salary data for Kirkland, WA:
Frequently Asked Questions
How much do plumbers make in Kirkland, WA in 2026?
Is Kirkland, WA a good place to work as a plumber?
Can plumbers make $100K in Kirkland?
What is the cost-of-living adjusted plumber salary in Kirkland?
How much does a plumber make per hour in Kirkland?
Related Pages
Compare Salaries
Career Resources
Nearby Cities in Washington
Written by Samuel Torres, CWP
Career Analyst
Samuel Torres has 10 years of experience in plumbing. He specializes in residential plumbing systems. He has worked with several home improvement companies.
Methodology & Data Source
Salary figures on this page are 2026 projections based on the Bureau of Labor Statistics Occupational Employment and Wage Statistics (OEWS) survey, May 2026 release. The BLS reported a median annual salary of $79,759 for plumbersin the Kirkland metropolitan area. A 2.52% compound annual growth rate (CAGR), calculated from 6-year national BLS wage trends, was applied to project current 2026 compensation. Percentile ranges (P10–P90) represent the full salary distribution across experience levels and practice settings in this market.
Data Sources & Methodology
Salary data for Kirkland is estimated from official BLS state-level occupational wage data (2025), adjusted for regional cost-of-living differences using BEA RPP (Regional Price Parities).
2026 figures are projected from 2025 BLS data using a compound annual growth rate (CAGR) of 2.52%, derived from historical BLS wage trends for plumbers (SOC 47-2152).
Compiled and verified by Samuel Torres, CWP, a licensed plumber with 10+ years of clinical experience. · View source data at BLS.gov