Plumber Salary in Covington, WA: $77,022 (2026)
Quick Answer:A full-time plumber in Covington, WA earns a median $77,022/year (≈ $37.03/hour) in nominal terms for 2026 — projected from BLS OEWS 2025 (SOC 47-2152). Once you factor in Covington's price level (7% above national, BEA RPP 107.4), that paycheck buys what $71,715 would nationally. Nominal pay sits 6.1% below the Washington state average.
Based on BLS state-level estimates · View source
In Covington, Washington, the projected salary for plumbers in 2026 stands at $77,022 annually, which showcases a significant advantage for tradespeople in this region when compared to the national median of $65,408. The salary range for plumbers in this area spans from $53,550 at the 10th percentile to as high as $119,385 at the 90th percentile, indicating a diverse spectrum of earning potential influenced by skill set and specialization. These figures, derived from BLS state-level data and adjusted for regional price parities, illustrate that those equipped with advanced credentials—such as medical gas or industrial pipefitting—can secure a premium. This higher earning potential aligns with Cobinson’s growing demand for skilled plumbing professionals, especially in a city with evolving infrastructure and a need for upgraded utility systems.
About the Covington Market
Salary estimated from Washington average ($82,000) adjusted for local cost of living.
Salary Breakdown
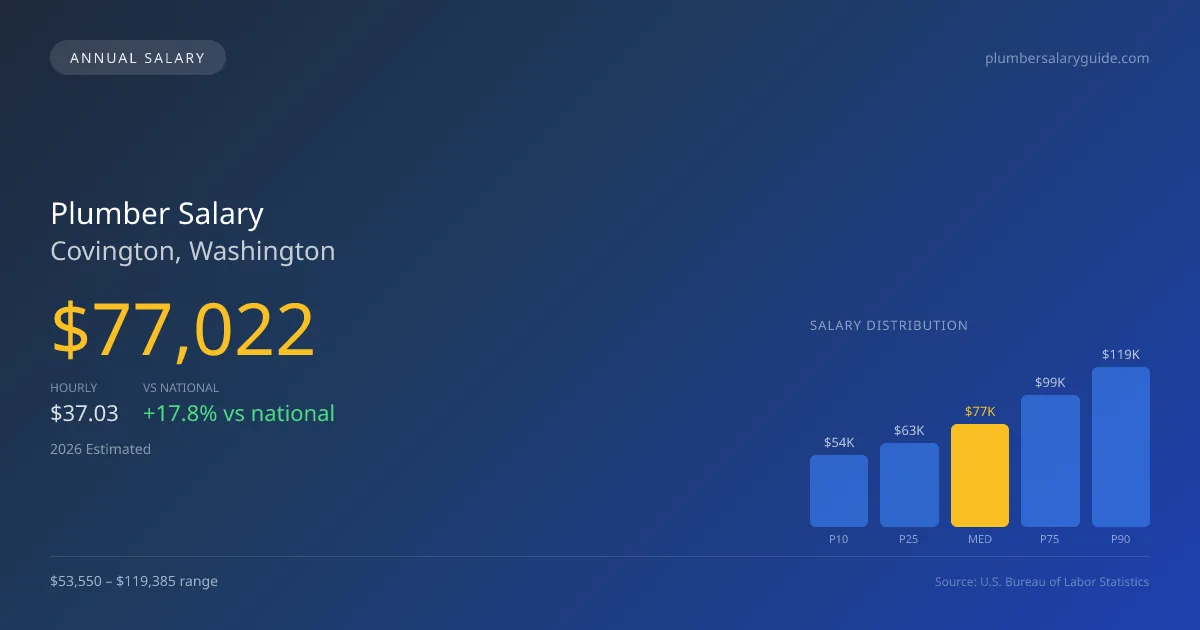
| Percentile | Annual | Hourly |
|---|---|---|
| Entry Level (P10) | $53,550 | $25.74 |
| Lower Range (P25) | $62,637 | $30.11 |
| Median (P50)(typical) | $77,022 | $37.03 |
| Upper Range (P75) | $98,588 | $47.39 |
| Top Earners (P90) | $119,385 | $57.40 |
Median Salary Position
17.76% above the national average
2026 Salary Percentile Distribution in Covington
In Covington, WA, the plumber salary spread from the 10th to 90th percentile is $65,835 (2026 est.). At $77,022, the local median is 17.76% above the national median of $65,408.
Salary Calculator
At 40 hours/week in Covington: You'd be in the lower-middle range
How Covington Plumber Pay Compares
Covington median: $77,022/year (2026)
| Compared To | Median Salary | Covington Pays |
|---|---|---|
| Washington Average | $82,026 | -6.10% less |
| National Average | $65,408 | +17.76% more |
Plumbers in Covington, WA earn a median of $77,022 per year (2026 est.), which is 17.76% higher than the national median of $65,408 and 6.10% below the Washington state average of $82,026.
Cost-of-Living Adjusted Salary
Covington has a cost of living 7.40% above the national average.
Adjusted salary = nominal × (100 / CoL index). CoL index: 100 = national average.
Covington, WA has a cost-of-living index of 107.4 (above the national average of 100). While the nominal salary of $77,022 is competitive, the higher cost of living reduces purchasing power to an effective $71,715 — a 6.89% reduction.
Compare Purchasing Power
Select a city to see how your salary compares after cost of living
Select a city above to compare purchasing power
2019 BLS Actual
$64,955
2025 BLS Actual
$75,129
2026 Current Est.
$77,022
2019–2027 Growth
+21.6%
Salary Trajectory for Plumbers in Covington (2019–2027)
2019–2025: actual BLS OEWS data for this metro area. 2026+: CAGR 2.52% projection.
| Year | Annual Salary | Status |
|---|---|---|
| 2019 | $64,955 | Actual |
| 2020 | $66,333 | Actual |
| 2021 | $70,513 | Actual |
| 2022 | $70,760 | Actual |
| 2023 | $72,479 | Actual |
| 2024 | $82,675 | Actual |
| 2025 | $75,129 | Actual |
| 2026(current) | $77,022 | Estimated |
| 2027 | $78,963 | Projected |
Based on 7 years of BLS OEWS data for the Covington metropolitan area, the median plumber salary grew 15.7% from $64,955 (2019) to $75,129 (2025). At a 2.52% compound annual growth rate, salaries are projected to reach $78,963 by 2027 — a total increase of $14,008 (21.57%) from 2019.
Note: Historical values (2019–2025) are actual BLS OEWS figures for the Covington metropolitan area, sourced from annual Occupational Employment and Wage Statistics surveys. 2026–2026 figures are current estimates, and 2027 values are projections, calculated using a 2.52% CAGR derived from 7-year BLS historical data. Actual salaries may vary based on employer, experience, certifications, and local market conditions.
Salary by Experience Level
| Experience | Estimated Salary Range |
|---|---|
| 0-2 years (New Graduate) | $53,550 – $62,637 |
| 3-5 years (Mid Career) | $62,637 – $77,022 |
| 5+ years (Experienced) | $77,022 – $98,588 |
| 10+ years (Top Earner) | $98,588 – $119,385 |
Plumber salary ranges estimated from BLS percentile data. Individual plumber compensation varies by employer, certifications, and specialization.
Plumber Job Market in Covington
With only five plumbers currently employed in Covington, the local job market presents unique dynamics that can impact plumber pay. The cost of living index for Covington is at 107.4, indicating that living expenses are above the national average and affecting take-home purchasing power. Union-affiliated plumbers, particularly those working with the United Association (UA), often see higher wages, sometimes ranging 30-50% more compared to non-union counterparts. Employers such as large service companies and industrial maintenance teams typically offer the highest pay, capitalizing on the specialized skills in demand. The disparity in earnings emerges from various factors, including union benefits, specialty licensing, and the varying nature of plumbing work—ranging from service to industrial and construction sectors. For plumbers aiming to maximize their pay in Covington, pursuing UA membership, acquiring specialty credentials, and considering commission-based positions could lead to enhanced earnings potential.
More salary data for Covington, WA:
Frequently Asked Questions
How much do plumbers make in Covington, WA in 2026?
Is Covington, WA a good place to work as a plumber?
Can plumbers make $100K in Covington?
What is the cost-of-living adjusted plumber salary in Covington?
How much does a plumber make per hour in Covington?
Related Pages
Compare Salaries
Career Resources
Nearby Cities in Washington
Written by Samuel Torres, CWP
Career Analyst
Samuel Torres has 10 years of experience in plumbing. He specializes in residential plumbing systems. He has worked with several home improvement companies.
Methodology & Data Source
Salary figures on this page are 2026 projections based on the Bureau of Labor Statistics Occupational Employment and Wage Statistics (OEWS) survey, May 2026 release. The BLS reported a median annual salary of $75,129 for plumbersin the Covington metropolitan area. A 2.52% compound annual growth rate (CAGR), calculated from 6-year national BLS wage trends, was applied to project current 2026 compensation. Percentile ranges (P10–P90) represent the full salary distribution across experience levels and practice settings in this market.
Data Sources & Methodology
Salary data for Covington is estimated from official BLS state-level occupational wage data (2025), adjusted for regional cost-of-living differences using BEA RPP (Regional Price Parities).
2026 figures are projected from 2025 BLS data using a compound annual growth rate (CAGR) of 2.52%, derived from historical BLS wage trends for plumbers (SOC 47-2152).
Compiled and verified by Samuel Torres, CWP, a licensed plumber with 10+ years of clinical experience. · View source data at BLS.gov