Plumber Salary in Bellevue, WA: $98,586 (2026)
Quick Answer:A full-time plumber in Bellevue, WA earns a median $98,586/year (≈ $47.39/hour) in nominal terms for 2026 — projected from BLS OEWS 2025 (SOC 47-2152). Once you factor in Bellevue's price level (7% above national, BEA RPP 107.4), that paycheck buys what $91,793 would nationally. Nominal pay sits 20.2% above the Washington state average.
Based on BLS state-level estimates · View source
In Bellevue, Washington, plumbers can expect a competitive median annual salary of $98,586 in 2026, significantly higher than the national average of $65,408. This compelling figure reflects the robust demand for skilled plumbing professionals in the region and the impact of specialized certifications, such as medical gas and industrial pipefitting, which command premium pay. The salary distribution ranges from $64,491 at the 10th percentile to $152,809 at the 90th percentile, indicating a diverse market with varying compensation based on experience, specialization, and the nature of the work. These local estimates, derived from BLS state-level data and adjusted for regional price parities, illustrate the strong earning potential for plumbers in Bellevue, especially in a job market where the need for skilled labor continues to grow.
About the Bellevue Market
Salary estimated from Washington average ($82,000) adjusted for local cost of living.
Salary Breakdown
| Percentile | Annual | Hourly |
|---|---|---|
| Entry Level (P10) | $64,491 | $31.00 |
| Lower Range (P25) | $74,547 | $35.84 |
| Median (P50)(typical) | $98,586 | $47.39 |
| Upper Range (P75) | $126,191 | $60.67 |
| Top Earners (P90) | $152,809 | $73.47 |
Median Salary Position
50.72% above the national average
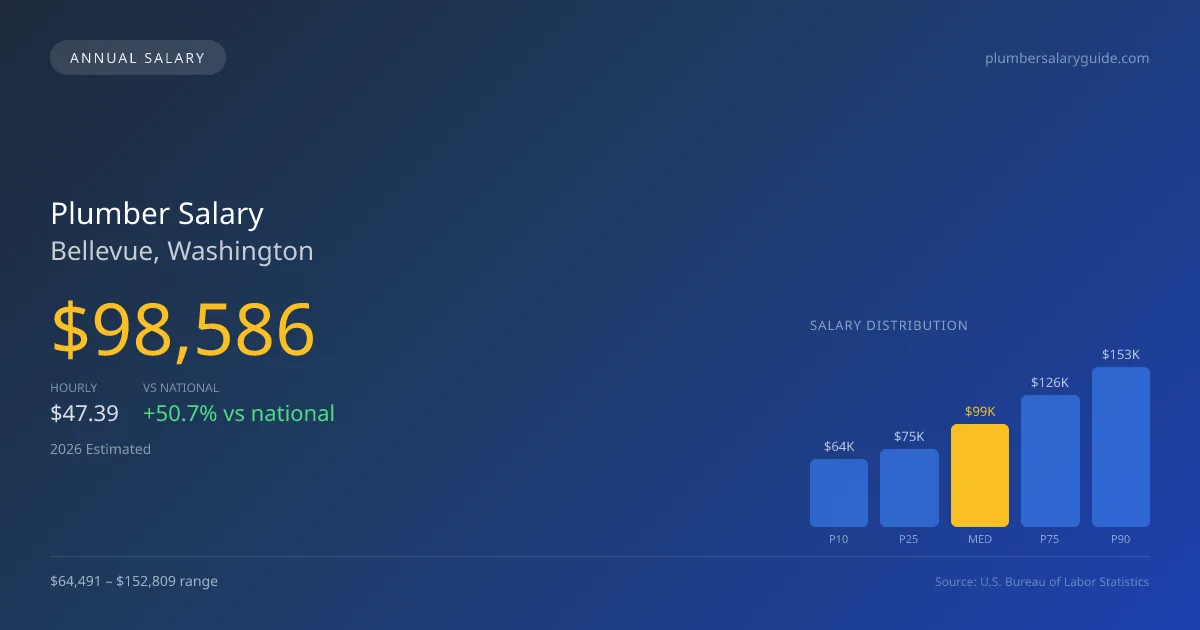
2026 Salary Percentile Distribution in Bellevue
In Bellevue, WA, the plumber salary spread from the 10th to 90th percentile is $88,318 (2026 est.). At $98,586, the local median is 50.72% above the national median of $65,408.
Salary Calculator
At 40 hours/week in Bellevue: You'd be in the lower-middle range
How Bellevue Plumber Pay Compares
Bellevue median: $98,586/year (2026)
| Compared To | Median Salary | Bellevue Pays |
|---|---|---|
| Washington Average | $82,019 | +20.20% more |
| National Average | $65,408 | +50.72% more |
Plumbers in Bellevue, WA earn a median of $98,586 per year (2026 est.), which is 50.72% higher than the national median of $65,408 and 20.20% above the Washington state average of $82,019.
Cost-of-Living Adjusted Salary
Bellevue has a cost of living 7.40% above the national average.
Adjusted salary = nominal × (100 / CoL index). CoL index: 100 = national average.
Bellevue, WA has a cost-of-living index of 107.4 (above the national average of 100). While the nominal salary of $98,586 is competitive, the higher cost of living reduces purchasing power to an effective $91,793 — a 6.89% reduction.
Compare Purchasing Power
Select a city to see how your salary compares after cost of living
Select a city above to compare purchasing power
2019 BLS Actual
$83,140
2025 BLS Actual
$96,163
2026 Current Est.
$98,586
2019–2027 Growth
+21.6%
Salary Trajectory for Plumbers in Bellevue (2019–2027)
2019–2025: actual BLS OEWS data for this metro area. 2026+: CAGR 2.52% projection.
| Year | Annual Salary | Status |
|---|---|---|
| 2019 | $83,140 | Actual |
| 2020 | $84,904 | Actual |
| 2021 | $90,255 | Actual |
| 2022 | $90,571 | Actual |
| 2023 | $92,772 | Actual |
| 2024 | $89,820 | Actual |
| 2025 | $96,163 | Actual |
| 2026(current) | $98,586 | Estimated |
| 2027 | $101,071 | Projected |
Based on 7 years of BLS OEWS data for the Bellevue metropolitan area, the median plumber salary grew 15.7% from $83,140 (2019) to $96,163 (2025). At a 2.52% compound annual growth rate, salaries are projected to reach $101,071 by 2027 — a total increase of $17,931 (21.57%) from 2019.
Note: Historical values (2019–2025) are actual BLS OEWS figures for the Bellevue metropolitan area, sourced from annual Occupational Employment and Wage Statistics surveys. 2026–2026 figures are current estimates, and 2027 values are projections, calculated using a 2.52% CAGR derived from 7-year BLS historical data. Actual salaries may vary based on employer, experience, certifications, and local market conditions.
Salary by Experience Level
| Experience | Estimated Salary Range |
|---|---|
| 0-2 years (New Graduate) | $64,491 – $74,547 |
| 3-5 years (Mid Career) | $74,547 – $98,586 |
| 5+ years (Experienced) | $98,586 – $126,191 |
| 10+ years (Top Earner) | $126,191 – $152,809 |
Plumber salary ranges estimated from BLS percentile data. Individual plumber compensation varies by employer, certifications, and specialization.
Plumber Job Market in Bellevue
The local plumbing job market in Bellevue is characterized by the employment of about 26 plumbers, indicating a tight but competitive workforce. With a cost of living index of 107.4, the purchasing power for local plumbers can be affected, emphasizing the importance of compensation strategies. Within this context, union plumbing contractors, such as those affiliated with the UA, often provide the highest pay, sometimes 30-50% more than non-union counterparts. Specialty roles, like medical gas installation, further elevate salaries, as does obtaining advanced licensing such as a master plumber or contractor licenses. For plumbers seeking to maximize their salary in Bellevue, aligning with reputable service companies or pursuing self-employment can be effective pathways. The key to higher earnings often lies in diversifying skills, seeking niche certifications, and understanding the dynamics of the local market.
More salary data for Bellevue, WA:
Frequently Asked Questions
How much do plumbers make in Bellevue, WA in 2026?
Is Bellevue, WA a good place to work as a plumber?
Can plumbers make $100K in Bellevue?
What is the cost-of-living adjusted plumber salary in Bellevue?
How much does a plumber make per hour in Bellevue?
Related Pages
Compare Salaries
Career Resources
Nearby Cities in Washington
Written by Samuel Torres, CWP
Career Analyst
Samuel Torres has 10 years of experience in plumbing. He specializes in residential plumbing systems. He has worked with several home improvement companies.
Methodology & Data Source
Salary figures on this page are 2026 projections based on the Bureau of Labor Statistics Occupational Employment and Wage Statistics (OEWS) survey, May 2026 release. The BLS reported a median annual salary of $96,163 for plumbersin the Bellevue metropolitan area. A 2.52% compound annual growth rate (CAGR), calculated from 6-year national BLS wage trends, was applied to project current 2026 compensation. Percentile ranges (P10–P90) represent the full salary distribution across experience levels and practice settings in this market.
Data Sources & Methodology
Salary data for Bellevue is estimated from official BLS state-level occupational wage data (2025), adjusted for regional cost-of-living differences using BEA RPP (Regional Price Parities).
2026 figures are projected from 2025 BLS data using a compound annual growth rate (CAGR) of 2.52%, derived from historical BLS wage trends for plumbers (SOC 47-2152).
Compiled and verified by Samuel Torres, CWP, a licensed plumber with 10+ years of clinical experience. · View source data at BLS.gov