Plumber Salary in Bennington, VT: $64,870 (2026)
Quick Answer:A full-time plumber in Bennington, VT earns a median $64,870/year (≈ $31.19/hour) in nominal terms for 2026 — projected from BLS OEWS 2025 (SOC 47-2152). Once you factor in Bennington's price level (4% above national, BEA RPP 103.5), that paycheck buys what $62,676 would nationally. Nominal pay sits 4.2% below the Vermont state average.
Based on BLS state-level estimates · View source
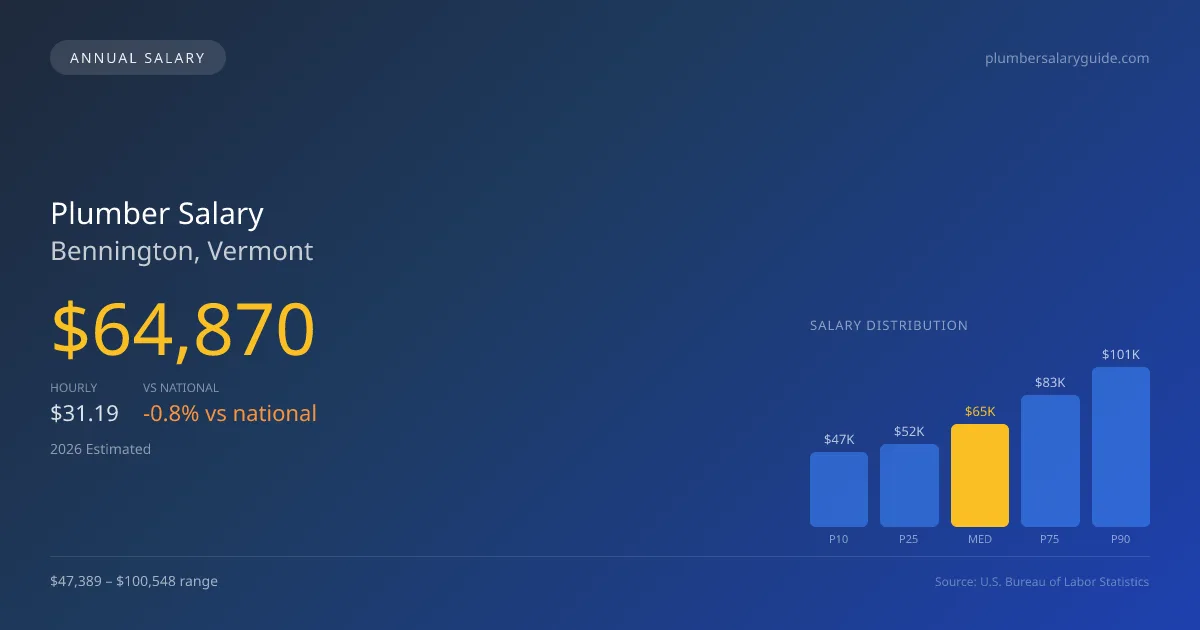
In 2026, plumbers in Bennington, Vermont, can expect a median annual salary of $64,870, which is slightly below the national median of $65,408. The salary range for this occupation varies significantly, with the lowest earners making approximately $47,389 and the highest achieving up to $100,548. These figures are derived from BLS state-level data and regional price parity adjustments. Notably, specialty certifications, such as medical gas installation and industrial plumbing, can substantially enhance earning potential, further reflecting on the competitive market for skilled plumbing professionals in Bennington.
About the Bennington Market
Salary estimated from Vermont average ($62,000) adjusted for local cost of living.
Salary Breakdown
| Percentile | Annual | Hourly |
|---|---|---|
| Entry Level (P10) | $47,389 | $22.78 |
| Lower Range (P25) | $51,867 | $24.93 |
| Median (P50)(typical) | $64,870 | $31.19 |
| Upper Range (P75) | $83,033 | $39.92 |
| Top Earners (P90) | $100,548 | $48.34 |
Median Salary Position
0.82% below the national average
2026 Salary Percentile Distribution in Bennington
In Bennington, VT, the plumber salary spread from the 10th to 90th percentile is $53,159 (2026 est.). At $64,870, the local median is 0.82% below the national median of $65,408.
Salary Calculator
At 40 hours/week in Bennington: You'd be in the lower-middle range
How Bennington Plumber Pay Compares
Bennington median: $64,870/year (2026)
| Compared To | Median Salary | Bennington Pays |
|---|---|---|
| Vermont Average | $67,713 | -4.20% less |
| National Average | $65,408 | -0.82% less |
Plumbers in Bennington, VT earn a median of $64,870 per year (2026 est.), which is 0.82% lower than the national median of $65,408 and 4.20% below the Vermont state average of $67,713.
Cost-of-Living Adjusted Salary
Bennington has a cost of living 3.50% above the national average.
Adjusted salary = nominal × (100 / CoL index). CoL index: 100 = national average.
Bennington, VT has a cost-of-living index of 103.5 (above the national average of 100). While the nominal salary of $64,870 is competitive, the higher cost of living reduces purchasing power to an effective $62,676 — a 3.38% reduction.
Compare Purchasing Power
Select a city to see how your salary compares after cost of living
Select a city above to compare purchasing power
2019 BLS Actual
$54,706
2025 BLS Actual
$63,275
2026 Current Est.
$64,870
2019–2027 Growth
+21.6%
Salary Trajectory for Plumbers in Bennington (2019–2027)
2019–2025: actual BLS OEWS data for this metro area. 2026+: CAGR 2.52% projection.
| Year | Annual Salary | Status |
|---|---|---|
| 2019 | $54,706 | Actual |
| 2020 | $55,866 | Actual |
| 2021 | $59,387 | Actual |
| 2022 | $59,596 | Actual |
| 2023 | $61,044 | Actual |
| 2024 | $61,490 | Actual |
| 2025 | $63,275 | Actual |
| 2026(current) | $64,870 | Estimated |
| 2027 | $66,504 | Projected |
Based on 7 years of BLS OEWS data for the Bennington metropolitan area, the median plumber salary grew 15.7% from $54,706 (2019) to $63,275 (2025). At a 2.52% compound annual growth rate, salaries are projected to reach $66,504 by 2027 — a total increase of $11,798 (21.57%) from 2019.
Note: Historical values (2019–2025) are actual BLS OEWS figures for the Bennington metropolitan area, sourced from annual Occupational Employment and Wage Statistics surveys. 2026–2026 figures are current estimates, and 2027 values are projections, calculated using a 2.52% CAGR derived from 7-year BLS historical data. Actual salaries may vary based on employer, experience, certifications, and local market conditions.
Salary by Experience Level
| Experience | Estimated Salary Range |
|---|---|
| 0-2 years (New Graduate) | $47,389 – $51,867 |
| 3-5 years (Mid Career) | $51,867 – $64,870 |
| 5+ years (Experienced) | $64,870 – $83,033 |
| 10+ years (Top Earner) | $83,033 – $100,548 |
Plumber salary ranges estimated from BLS percentile data. Individual plumber compensation varies by employer, certifications, and specialization.
Plumber Job Market in Bennington
The local plumbing job market consists of a small yet stable workforce, with just six plumbers currently employed in the area. While Bennington's cost-of-living index stands at 103.5, implying higher living expenses relative to the national average, this context significantly impacts take-home pay and purchasing power. Among local employers, unionized contractors affiliated with the United Association typically offer the most competitive pay compared to non-union firms and self-employed plumbers. The variation in salaries can be attributed to factors such as the type of work—ranging from residential service to specialized industrial projects—and credentials like master and contractor licenses. To maximize earnings in this specific market, plumbers should consider acquiring additional certifications, particularly in high-demand specialties, while exploring opportunities for overtime and service-based commission models offered by larger plumbing companies.
More salary data for Bennington, VT:
Frequently Asked Questions
How much do plumbers make in Bennington, VT in 2026?
Is Bennington, VT a good place to work as a plumber?
Can plumbers make $100K in Bennington?
What is the cost-of-living adjusted plumber salary in Bennington?
How much does a plumber make per hour in Bennington?
Related Pages
Compare Salaries
Career Resources
Nearby Cities in Vermont
Written by Samuel Torres, CWP
Career Analyst
Samuel Torres has 10 years of experience in plumbing. He specializes in residential plumbing systems. He has worked with several home improvement companies.
Methodology & Data Source
Salary figures on this page are 2026 projections based on the Bureau of Labor Statistics Occupational Employment and Wage Statistics (OEWS) survey, May 2026 release. The BLS reported a median annual salary of $63,275 for plumbersin the Bennington metropolitan area. A 2.52% compound annual growth rate (CAGR), calculated from 6-year national BLS wage trends, was applied to project current 2026 compensation. Percentile ranges (P10–P90) represent the full salary distribution across experience levels and practice settings in this market.
Data Sources & Methodology
Salary data for Bennington is estimated from official BLS state-level occupational wage data (2025), adjusted for regional cost-of-living differences using BEA RPP (Regional Price Parities).
2026 figures are projected from 2025 BLS data using a compound annual growth rate (CAGR) of 2.52%, derived from historical BLS wage trends for plumbers (SOC 47-2152).
Compiled and verified by Samuel Torres, CWP, a licensed plumber with 10+ years of clinical experience. · View source data at BLS.gov