Plumber Salary in Vermont: $68,766 (2026)
Quick Answer:Across Vermont's 9 metropolitan areas, the average median plumber pay sits at $68,766/year heading into 2026 — a figure projected from 2025 BLS OEWS wage data for SOC 47-2152. Because Vermont sits at BEA RPP 103.5 (4% above the U.S. baseline), that statewide median translates to roughly $66,441 in nationally-comparable purchasing power. Highest-paying metros: South Burlington ($67,793), Burlington ($67,450), Bennington ($63,275).
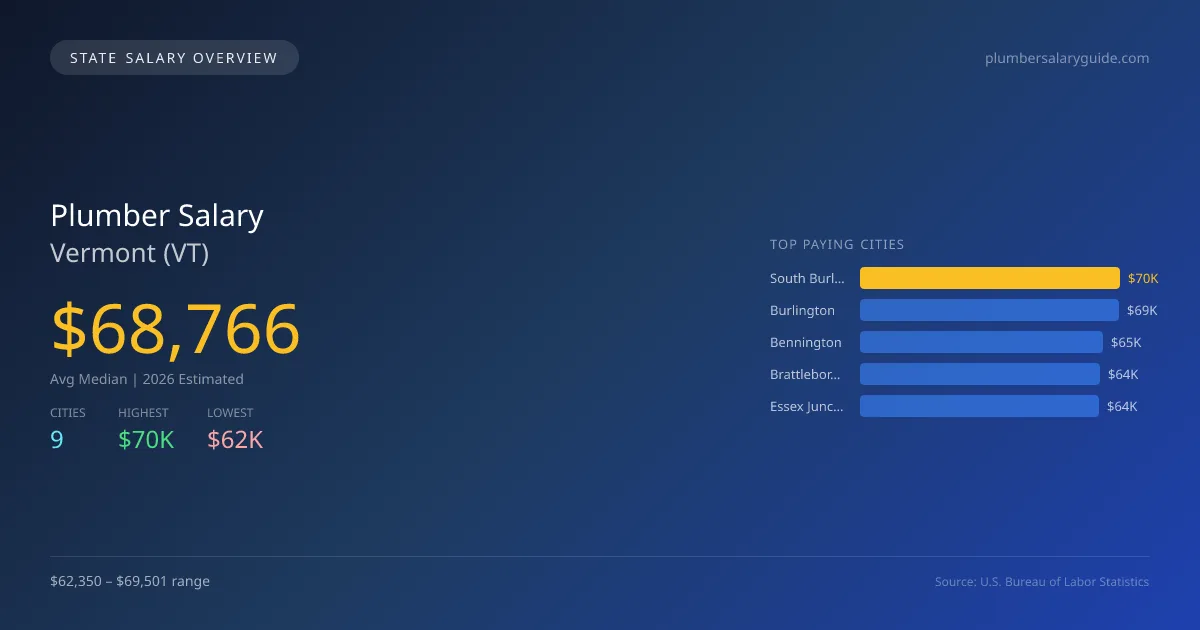
In 2026, plumbers in Vermont are projected to earn an average median salary of $68,766, which is 5.1% higher than the national median of $65,408. The highest paying city for plumbers is South Burlington, with an estimated salary of $69,501, while Montpelier has the lowest at $62,350, resulting in a salary gap of $7,151. This variation can be attributed to factors such as cost of living, demand for plumbing services, and local market conditions. Vermont's plumbing industry is influenced by state-specific licensing requirements, which necessitate a combination of education and apprenticeship for new professionals. Additionally, the state's scope of practice laws dictate what plumbers can lawfully perform, impacting job opportunities and job roles. A projected annual growth rate of 2.52% in employment suggests a steady demand for plumbers, driven by ongoing construction and maintenance needs across the state. Major cities like Burlington and Bennington reflect competitive salaries of $69,150 and $64,870, respectively. With a total of 510 plumbers employed statewide, the job market remains stable, supported by consistent infrastructure development and residential renovations.
Vermont Plumber Salary Range
Overall salary range in Vermont: $45,053 (lowest entry-level) to $107,727 (highest top earner)
Vermont vs National Average
Vermont plumbers earn 5.13% more than the national median (+$3,358/year difference).
Vermont Plumber Salary Distribution (2026)
Plumber salaries in Vermont range from $49,754 (entry-level, 10th percentile) to $94,270 (top earners, 90th percentile), with a median of $68,766. The Vermont median is $3,358 above the US national median of $65,408. The average hourly rate is $33.06/hr. Approximately 510 plumbers are employed across 9 cities.
2019 BLS Actual
$53,430
2025 BLS Actual
$67,076
2026 Current Est.
$68,766
2019–2027 Growth
+31.9%
Salary Trajectory for Plumbers in Vermont (2019–2027)
2019–2025: actual BLS OEWS data for this metro area. 2026+: CAGR 2.52% projection.
| Year | Annual Salary | Status |
|---|---|---|
| 2019 | $53,430 | Actual |
| 2020 | $50,320 | Actual |
| 2021 | $55,370 | Actual |
| 2022 | $57,730 | Actual |
| 2023 | $60,770 | Actual |
| 2024 | $62,920 | Actual |
| 2025 | $67,076 | Actual |
| 2026(current) | $68,766 | Estimated |
| 2027 | $70,499 | Projected |
Based on 7 years of BLS OEWS data for the Vermont metropolitan area, the median plumber salary grew 25.5% from $53,430 (2019) to $67,076 (2025). At a 2.52% compound annual growth rate, salaries are projected to reach $70,499 by 2027 — a total increase of $17,069 (31.95%) from 2019.
Note: Historical values (2019–2025) are actual BLS OEWS figures for the Vermont metropolitan area, sourced from annual Occupational Employment and Wage Statistics surveys. 2026–2026 figures are current estimates, and 2027 values are projections, calculated using a 2.52% CAGR derived from 7-year BLS historical data. Actual salaries may vary based on employer, experience, certifications, and local market conditions.
Top 5 Highest Paying Cities in Vermont
Lowest Paying Cities in Vermont
| City | Median Salary |
|---|---|
| Montpelier | $62,350 |
| Colchester | $62,665 |
| Rutland | $62,737 |
| Barre | $63,913 |
| Essex Junction | $63,999 |
Best Value Cities for Plumbers in Vermont
When adjusted for local cost of living, these Vermont cities offer the most purchasing power for plumbers.
| City | Nominal Salary | CoL Index | Adjusted Salary |
|---|---|---|---|
| Burlington | $69,150 | 100.949 | $68,500 |
| South Burlington | $69,501 | 103.5 | $67,151 |
| Bennington | $64,870 | 103.5 | $62,676 |
| Brattleboro | $64,137 | 103.5 | $61,968 |
| Essex Junction | $63,999 | 103.5 | $61,835 |
Adjusted salary = nominal salary × (100 / CoL index). CoL index: 100 = national average. Lower index = lower cost of living.
Salary by Experience Level in Vermont
| Experience Level | Estimated Annual |
|---|---|
| Entry Level (0-2 years) | $49,754 |
| Mid Career (3-7 years) | $68,766 |
| Experienced (7+ years) | $94,270 |
Estimates based on BLS percentile data averaged across Vermont metro areas. Individual pay varies by employer, certifications, and specialization.
All 9 Cities in Vermont
| # | City | Median Salary |
|---|---|---|
| 1 | South Burlington | $69,501 |
| 2 | Burlington | $69,150 |
| 3 | Bennington | $64,870 |
| 4 | Brattleboro | $64,137 |
| 5 | Essex Junction | $63,999 |
| 6 | Barre | $63,913 |
| 7 | Rutland | $62,737 |
| 8 | Colchester | $62,665 |
| 9 | Montpelier | $62,350 |
More Vermont Salary Data
Senior / Experienced
Top earner salaries for experienced plumbers.
Explore More Plumber Salary Data
Frequently Asked Questions
How much do plumbers make in Vermont in 2026?
What is the highest paying city for plumbers in Vermont?
How does Vermont plumber pay compare to the national average?
What is the entry-level plumber salary in Vermont?
How many plumbers are employed in Vermont?
Which Vermont city offers the best value for plumbers?
Written by Samuel Torres, CWP
Career Analyst
Samuel Torres has 10 years of experience in plumbing. He specializes in residential plumbing systems. He has worked with several home improvement companies.
Methodology & Data Source
Statewide salary figures on this page are 2026 projections based on the Bureau of Labor Statistics Occupational Employment and Wage Statistics (OEWS) survey, May 2026 release. A 2.52% compound annual growth rate (CAGR), derived from 6-year national BLS wage trends, was applied to each metro area's reported salary to estimate current 2026 plumber compensation across Vermont. State averages are employment-weighted across 9 metro areas — larger metro areas with more plumberscontribute proportionally more to the average, producing figures that better reflect typical compensation. Individual pay varies by city, employer, certifications, and experience.
Data Sources & Methodology
Source: BLS, OEWS, 7-year dataset (–). Per-city data from annual BLS metropolitan area surveys.
2026 figures are projected from 2025 BLS data using a compound annual growth rate (CAGR) of 2.52%, derived from historical BLS wage trends for plumbers (SOC 47-2152).
Compiled and verified by Samuel Torres, CWP, a licensed plumber with 10+ years of clinical experience. · View source data at BLS.gov