Plumber Salary in St. Louis Park, MN: $83,988 (2026)
Quick Answer:A full-time plumber in St. Louis Park, MN earns a median $83,988/year (≈ $40.38/hour) in nominal terms for 2026 — projected from BLS OEWS 2025 (SOC 47-2152). Once you factor in St. Louis Park's price level (1% below national, BEA RPP 98.5), that paycheck buys what $85,267 would nationally. Nominal pay sits 3.7% below the Minnesota state average.
Based on BLS state-level estimates · View source
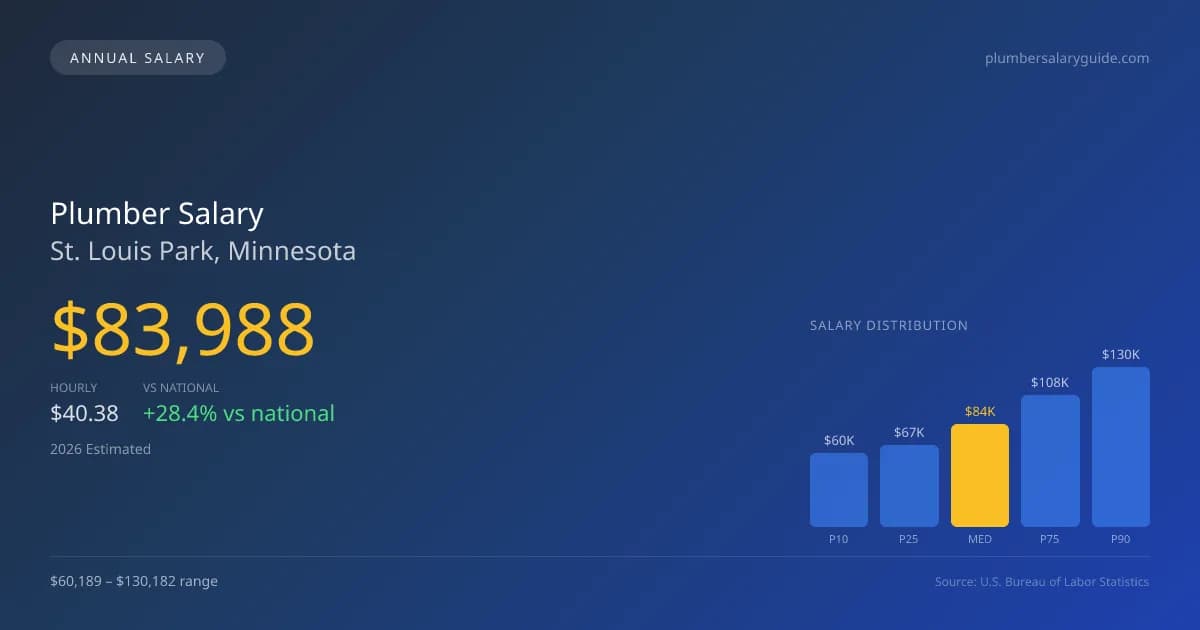
Plumbers in St. Louis Park, MN, can expect a competitive median annual salary of $83,988 in 2026, significantly higher than the national average of $65,408, indicating a premium in the local market. This occupation offers a broad salary range, from $60,189 at the 10th percentile to $130,182 at the 90th percentile, showcasing the potential for substantial earnings based on experience, specialization, and employer type. These figures are derived from state-level BLS data and regional price adjustments, reflecting the robust demand for skilled plumbing professionals in the area. With the industry poised for continued growth, those who invest in additional certifications, particularly in specialties like medical gas, can command even higher pay, further enhancing the financial prospects for plumbers in this thriving local economy.
About the St. Louis Park Market
Salary estimated from Minnesota average ($78,000) adjusted for local cost of living.
Salary Breakdown
| Percentile | Annual | Hourly |
|---|---|---|
| Entry Level (P10) | $60,189 | $28.94 |
| Lower Range (P25) | $66,648 | $32.04 |
| Median (P50)(typical) | $83,988 | $40.38 |
| Upper Range (P75) | $107,506 | $51.68 |
| Top Earners (P90) | $130,182 | $62.59 |
Median Salary Position
28.41% above the national average
2026 Salary Percentile Distribution in St. Louis Park
In St. Louis Park, MN, the plumber salary spread from the 10th to 90th percentile is $69,993 (2026 est.). At $83,988, the local median is 28.41% above the national median of $65,408.
Salary Calculator
At 40 hours/week in St. Louis Park: You'd be in the lower-middle range
How St. Louis Park Plumber Pay Compares
St. Louis Park median: $83,988/year (2026)
| Compared To | Median Salary | St. Louis Park Pays |
|---|---|---|
| Minnesota Average | $87,215 | -3.70% less |
| National Average | $65,408 | +28.41% more |
Plumbers in St. Louis Park, MN earn a median of $83,988 per year (2026 est.), which is 28.41% higher than the national median of $65,408 and 3.70% below the Minnesota state average of $87,215.
Cost-of-Living Adjusted Salary
St. Louis Park has a cost of living 1.50% below the national average, meaning your salary goes further here.
Adjusted salary = nominal × (100 / CoL index). CoL index: 100 = national average.
St. Louis Park, MN has a cost-of-living index of 98.5 (below the national average of 100). A plumber earning $83,988 nominally has purchasing power equivalent to $85,267 in an average-cost city — an effective 1.52% boost.
Compare Purchasing Power
Select a city to see how your salary compares after cost of living
Select a city above to compare purchasing power
2019 BLS Actual
$70,830
2025 BLS Actual
$81,924
2026 Current Est.
$83,988
2019–2027 Growth
+21.6%
Salary Trajectory for Plumbers in St. Louis Park (2019–2027)
2019–2025: actual BLS OEWS data for this metro area. 2026+: CAGR 2.52% projection.
| Year | Annual Salary | Status |
|---|---|---|
| 2019 | $70,830 | Actual |
| 2020 | $72,332 | Actual |
| 2021 | $76,890 | Actual |
| 2022 | $77,160 | Actual |
| 2023 | $79,035 | Actual |
| 2024 | $73,997 | Actual |
| 2025 | $81,924 | Actual |
| 2026(current) | $83,988 | Estimated |
| 2027 | $86,105 | Projected |
Based on 7 years of BLS OEWS data for the St. Louis Park metropolitan area, the median plumber salary grew 15.7% from $70,830 (2019) to $81,924 (2025). At a 2.52% compound annual growth rate, salaries are projected to reach $86,105 by 2027 — a total increase of $15,275 (21.57%) from 2019.
Note: Historical values (2019–2025) are actual BLS OEWS figures for the St. Louis Park metropolitan area, sourced from annual Occupational Employment and Wage Statistics surveys. 2026–2026 figures are current estimates, and 2027 values are projections, calculated using a 2.52% CAGR derived from 7-year BLS historical data. Actual salaries may vary based on employer, experience, certifications, and local market conditions.
Salary by Experience Level
| Experience | Estimated Salary Range |
|---|---|
| 0-2 years (New Graduate) | $60,189 – $66,648 |
| 3-5 years (Mid Career) | $66,648 – $83,988 |
| 5+ years (Experienced) | $83,988 – $107,506 |
| 10+ years (Top Earner) | $107,506 – $130,182 |
Plumber salary ranges estimated from BLS percentile data. Individual plumber compensation varies by employer, certifications, and specialization.
Plumber Job Market in St. Louis Park
In St. Louis Park, the strength of the job market can be seen in the employment of nine plumbers, demonstrating a focused demand for plumbing professionals. The local cost of living index stands at 98.5, slightly below the national average, which can affect take-home pay and purchasing power. Among local employers, union plumbing contractors tend to offer the highest salaries, often benefiting from the collective bargaining power of organizations like the UA (United Association). Conversely, plumbers in non-union settings, including residential service companies and light commercial contractors, may experience more variability in pay, especially if they are commission-based. The disparities in earnings encompass factors such as specialty credentials, like industrial pipefitting or medical gas qualifications, and the level of union membership. For plumbers seeking to maximize their earnings in St. Louis Park, pursuing advanced licenses, gaining experience in high-demand areas, and considering union affiliations are practical strategies that can lead to greater financial success in this evolving industry.
More salary data for St. Louis Park, MN:
Frequently Asked Questions
How much do plumbers make in St. Louis Park, MN in 2026?
Is St. Louis Park, MN a good place to work as a plumber?
Can plumbers make $100K in St. Louis Park?
What is the cost-of-living adjusted plumber salary in St. Louis Park?
How much does a plumber make per hour in St. Louis Park?
Related Pages
Compare Salaries
Career Resources
Nearby Cities in Minnesota
Written by Samuel Torres, CWP
Career Analyst
Samuel Torres has 10 years of experience in plumbing. He specializes in residential plumbing systems. He has worked with several home improvement companies.
Methodology & Data Source
Salary figures on this page are 2026 projections based on the Bureau of Labor Statistics Occupational Employment and Wage Statistics (OEWS) survey, May 2026 release. The BLS reported a median annual salary of $81,924 for plumbersin the St. Louis Park metropolitan area. A 2.52% compound annual growth rate (CAGR), calculated from 6-year national BLS wage trends, was applied to project current 2026 compensation. Percentile ranges (P10–P90) represent the full salary distribution across experience levels and practice settings in this market.
Data Sources & Methodology
Salary data for St. Louis Park is estimated from official BLS state-level occupational wage data (2025), adjusted for regional cost-of-living differences using BEA RPP (Regional Price Parities).
2026 figures are projected from 2025 BLS data using a compound annual growth rate (CAGR) of 2.52%, derived from historical BLS wage trends for plumbers (SOC 47-2152).
Compiled and verified by Samuel Torres, CWP, a licensed plumber with 10+ years of clinical experience. · View source data at BLS.gov