Plumber Salary in Rochester, MN: $87,019 (2026)
Quick Answer:A full-time plumber in Rochester, MN earns a median $87,019/year (≈ $41.84/hour) in nominal terms for 2026 — projected from BLS OEWS 2025 (SOC 47-2152). Once you factor in Rochester's price level (9% below national, BEA RPP 90.8), that paycheck buys what $95,814 would nationally. Nominal pay sits 0.2% below the Minnesota state average.
Official BLS data · View source
With a median annual salary of $87,019 projected for 2026, plumbing professionals in Rochester, Minnesota, enjoy a significant premium compared to the national average, which stands at $65,408. The salary range for plumbers varies widely, with entry-level positions starting around $49,989 and experienced professionals earning up to $109,389. These figures come from the most recent estimates based on 2025 BLS OEWS data, projected to 2026. The local job market supports around 490 plumbers, highlighting a demand driven in part by the city's aging infrastructure and a growing healthcare sector, which requires specialized skills in areas like medical gas installation.
Salary Breakdown
| Percentile | Annual | Hourly |
|---|---|---|
| Entry Level (P10) | $49,989 | $24.03 |
| Lower Range (P25) | $65,367 | $31.43 |
| Median (P50)(typical) | $87,019 | $41.84 |
| Upper Range (P75) | $107,472 | $51.67 |
| Top Earners (P90) | $109,389 | $52.59 |
Median Salary Position
33.04% above the national average
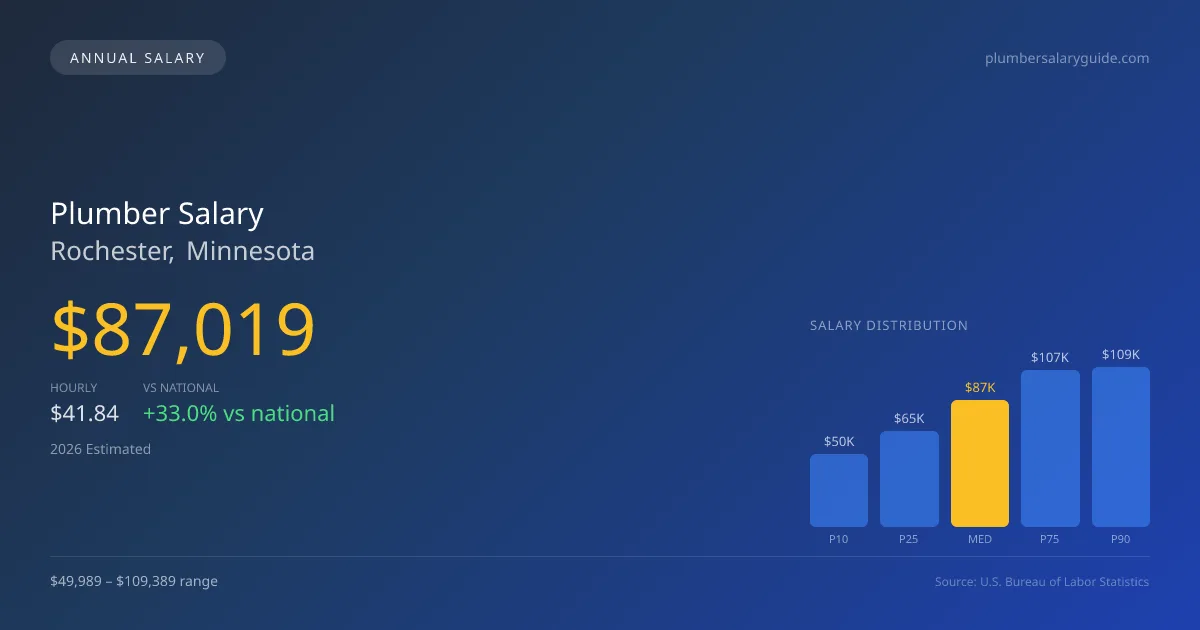
2026 Salary Percentile Distribution in Rochester
In Rochester, MN, the plumber salary spread from the 10th to 90th percentile is $59,400 (2026 est.). At $87,019, the local median is 33.04% above the national median of $65,408.
Salary Calculator
At 40 hours/week in Rochester: You'd be above the median
How Rochester Plumber Pay Compares
Rochester median: $87,019/year (2026)
| Compared To | Median Salary | Rochester Pays |
|---|---|---|
| Minnesota Average | $87,193 | -0.20% less |
| National Average | $65,408 | +33.04% more |
Plumbers in Rochester, MN earn a median of $87,019 per year (2026 est.), which is 33.04% higher than the national median of $65,408 and 0.20% below the Minnesota state average of $87,193.
Cost-of-Living Adjusted Salary
Rochester has a cost of living 9.18% below the national average, meaning your salary goes further here.
Adjusted salary = nominal × (100 / CoL index). CoL index: 100 = national average.
Rochester, MN has a cost-of-living index of 90.821 (below the national average of 100). A plumber earning $87,019 nominally has purchasing power equivalent to $95,814 in an average-cost city — an effective 10.11% boost.
Compare Purchasing Power
Select a city to see how your salary compares after cost of living
Select a city above to compare purchasing power
2019 BLS Actual
$72,080
2025 BLS Actual
$84,880
2026 Current Est.
$87,019
2019–2027 Growth
+23.8%
Salary Trajectory for Plumbers in Rochester (2019–2027)
2019–2025: actual BLS OEWS data for this metro area. 2026+: CAGR 2.52% projection.
| Year | Annual Salary | Status |
|---|---|---|
| 2019 | $72,080 | Actual |
| 2020 | $76,940 | Actual |
| 2021 | $80,530 | Actual |
| 2022 | $79,860 | Actual |
| 2023 | $93,870 | Actual |
| 2024 | $99,400 | Actual |
| 2025 | $84,880 | Actual |
| 2026(current) | $87,019 | Estimated |
| 2027 | $89,212 | Projected |
Based on 7 years of BLS OEWS data for the Rochester metropolitan area, the median plumber salary grew 17.8% from $72,080 (2019) to $84,880 (2025). At a 2.52% compound annual growth rate, salaries are projected to reach $89,212 by 2027 — a total increase of $17,132 (23.77%) from 2019.
Note: Historical values (2019–2025) are actual BLS OEWS figures for the Rochester metropolitan area, sourced from annual Occupational Employment and Wage Statistics surveys. 2026–2026 figures are current estimates, and 2027 values are projections, calculated using a 2.52% CAGR derived from 7-year BLS historical data. Actual salaries may vary based on employer, experience, certifications, and local market conditions.
Salary by Experience Level
| Experience | Estimated Salary Range |
|---|---|
| 0-2 years (New Graduate) | $49,989 – $65,367 |
| 3-5 years (Mid Career) | $65,367 – $87,019 |
| 5+ years (Experienced) | $87,019 – $107,472 |
| 10+ years (Top Earner) | $107,472 – $109,389 |
Plumber salary ranges estimated from BLS percentile data. Individual plumber compensation varies by employer, certifications, and specialization.
Plumber Job Market in Rochester
In Rochester, the cost of living index is notably below the national average at 90.821, meaning that plumbers can stretch their earnings further in this market. Various employer types influence plumber pay in Rochester MN, with union contracts often providing the highest wages, followed by industrial maintenance roles and established service companies. The gap between lower and higher salaries is driven by specialties such as medical gas and the differences in commission structures at service firms like Roto-Rooter. For those looking to maximize earnings, pursuing higher licensing and certifications, especially in specialty areas, as well as considering positions in union shops or industrial settings, may offer the best financial advantages among the various plumbing career paths available.
More salary data for Rochester, MN:
Frequently Asked Questions
How much do plumbers make in Rochester, MN in 2026?
Is Rochester, MN a good place to work as a plumber?
Can plumbers make $100K in Rochester?
What is the cost-of-living adjusted plumber salary in Rochester?
How much does a plumber make per hour in Rochester?
Related Pages
Compare Salaries
Career Resources
Nearby Cities in Minnesota
Written by Samuel Torres, CWP
Career Analyst
Samuel Torres has 10 years of experience in plumbing. He specializes in residential plumbing systems. He has worked with several home improvement companies.
Methodology & Data Source
Salary figures on this page are 2026 projections based on the Bureau of Labor Statistics Occupational Employment and Wage Statistics (OEWS) survey, May 2026 release. The BLS reported a median annual salary of $84,880 for plumbersin the Rochester metropolitan area. A 2.52% compound annual growth rate (CAGR), calculated from 6-year national BLS wage trends, was applied to project current 2026 compensation. Percentile ranges (P10–P90) represent the full salary distribution across experience levels and practice settings in this market.
Data Sources & Methodology
Source: BLS, OEWS, 7-year dataset (–). Per-city data from annual BLS metropolitan area surveys.
2026 figures are projected from 2025 BLS data using a compound annual growth rate (CAGR) of 2.52%, derived from historical BLS wage trends for plumbers (SOC 47-2152).
Compiled and verified by Samuel Torres, CWP, a licensed plumber with 10+ years of clinical experience. · View source data at BLS.gov