Plumber Salary in Duluth, MN: $87,204 (2026)
Quick Answer:A full-time plumber in Duluth, MN earns a median $87,204/year (≈ $41.92/hour) in nominal terms for 2026 — projected from BLS OEWS 2025 (SOC 47-2152). Once you factor in Duluth's price level (11% below national, BEA RPP 88.8), that paycheck buys what $98,238 would nationally. Nominal pay sits 0.0% above the Minnesota state average.
Official BLS data · View source
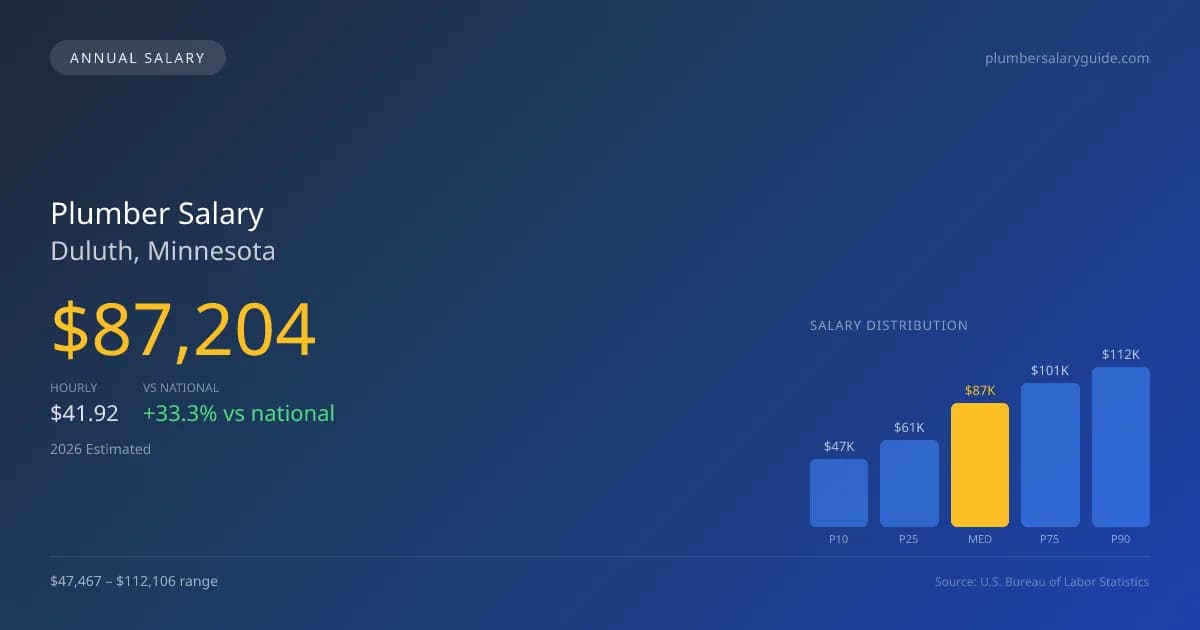
Plumbers in Duluth, Minnesota, can expect a median annual salary of $87,204 in 2026, reflecting a competitive rate that is significantly higher than the national median of $65,408. The salary range for this profession varies considerably, with entry-level positions earning around $47,467 while top earners can pull in as much as $112,106. This data, derived from 2025 BLS OEWS surveys, illustrates that the local market provides robust compensation opportunities for both employed plumbers and self-employed contractors. Factors such as specialty licenses, experience, and employment type—union versus non-union—create a diverse landscape within the plumbing trade that impacts earning potential.
Salary Breakdown
| Percentile | Annual | Hourly |
|---|---|---|
| Entry Level (P10) | $47,467 | $22.82 |
| Lower Range (P25) | $60,764 | $29.21 |
| Median (P50)(typical) | $87,204 | $41.92 |
| Upper Range (P75) | $100,593 | $48.36 |
| Top Earners (P90) | $112,106 | $53.89 |
Median Salary Position
33.32% above the national average
2026 Salary Percentile Distribution in Duluth
In Duluth, MN, the plumber salary spread from the 10th to 90th percentile is $64,639 (2026 est.). At $87,204, the local median is 33.32% above the national median of $65,408.
Salary Calculator
At 40 hours/week in Duluth: You'd be above the median
How Duluth Plumber Pay Compares
Duluth median: $87,204/year (2026)
| Compared To | Median Salary | Duluth Pays |
|---|---|---|
| National Average | $65,408 | +33.32% more |
Plumbers in Duluth, MN earn a median of $87,204 per year (2026 est.), which is 33.32% higher than the national median of $65,408.
Cost-of-Living Adjusted Salary
Duluth has a cost of living 11.23% below the national average, meaning your salary goes further here.
Adjusted salary = nominal × (100 / CoL index). CoL index: 100 = national average.
Duluth, MN has a cost-of-living index of 88.768 (below the national average of 100). A plumber earning $87,204 nominally has purchasing power equivalent to $98,238 in an average-cost city — an effective 12.65% boost.
Compare Purchasing Power
Select a city to see how your salary compares after cost of living
Select a city above to compare purchasing power
2019 BLS Actual
$67,420
2025 BLS Actual
$85,060
2026 Current Est.
$87,204
2019–2027 Growth
+32.6%
Salary Trajectory for Plumbers in Duluth (2019–2027)
2019–2025: actual BLS OEWS data for this metro area. 2026+: CAGR 2.52% projection.
| Year | Annual Salary | Status |
|---|---|---|
| 2019 | $67,420 | Actual |
| 2020 | $68,200 | Actual |
| 2021 | $75,090 | Actual |
| 2022 | $80,760 | Actual |
| 2023 | $88,000 | Actual |
| 2024 | $87,420 | Actual |
| 2025 | $85,060 | Actual |
| 2026(current) | $87,204 | Estimated |
| 2027 | $89,401 | Projected |
Based on 7 years of BLS OEWS data for the Duluth metropolitan area, the median plumber salary grew 26.2% from $67,420 (2019) to $85,060 (2025). At a 2.52% compound annual growth rate, salaries are projected to reach $89,401 by 2027 — a total increase of $21,981 (32.60%) from 2019.
Note: Historical values (2019–2025) are actual BLS OEWS figures for the Duluth metropolitan area, sourced from annual Occupational Employment and Wage Statistics surveys. 2026–2026 figures are current estimates, and 2027 values are projections, calculated using a 2.52% CAGR derived from 7-year BLS historical data. Actual salaries may vary based on employer, experience, certifications, and local market conditions.
Salary by Experience Level
| Experience | Estimated Salary Range |
|---|---|
| 0-2 years (New Graduate) | $47,467 – $60,764 |
| 3-5 years (Mid Career) | $60,764 – $87,204 |
| 5+ years (Experienced) | $87,204 – $100,593 |
| 10+ years (Top Earner) | $100,593 – $112,106 |
Plumber salary ranges estimated from BLS percentile data. Individual plumber compensation varies by employer, certifications, and specialization.
Plumber Job Market in Duluth
Duluth's job market is solid, currently employing 420 plumbers amid a cost of living index of 88.768, which means that the purchasing power is generally favorable compared to national averages. When considering employers, union plumbing contractors often provide the highest wages, followed by those in specialized areas such as medical gas installation. Self-employed plumbers also have the potential for higher earnings, but they face the variability associated with running their own business. Pay disparities between union and non-union positions, especially for advanced roles like pipefitters or steamfitters, highlight the benefits of having specializations and additional certifications. To maximize incomes, plumbers should consider pursuing advanced licensing, and gaining experience in specialty areas that are facing labor shortages, ensuring greater leverage in negotiations with employers.
More salary data for Duluth, MN:
Frequently Asked Questions
How much do plumbers make in Duluth, MN in 2026?
Is Duluth, MN a good place to work as a plumber?
Can plumbers make $100K in Duluth?
What is the cost-of-living adjusted plumber salary in Duluth?
How much does a plumber make per hour in Duluth?
Related Pages
Compare Salaries
Career Resources
Nearby Cities in Minnesota
Written by Samuel Torres, CWP
Career Analyst
Samuel Torres has 10 years of experience in plumbing. He specializes in residential plumbing systems. He has worked with several home improvement companies.
Methodology & Data Source
Salary figures on this page are 2026 projections based on the Bureau of Labor Statistics Occupational Employment and Wage Statistics (OEWS) survey, May 2026 release. The BLS reported a median annual salary of $85,060 for plumbersin the Duluth metropolitan area. A 2.52% compound annual growth rate (CAGR), calculated from 6-year national BLS wage trends, was applied to project current 2026 compensation. Percentile ranges (P10–P90) represent the full salary distribution across experience levels and practice settings in this market.
Data Sources & Methodology
Source: BLS, OEWS, 7-year dataset (–). Per-city data from annual BLS metropolitan area surveys.
2026 figures are projected from 2025 BLS data using a compound annual growth rate (CAGR) of 2.52%, derived from historical BLS wage trends for plumbers (SOC 47-2152).
Compiled and verified by Samuel Torres, CWP, a licensed plumber with 10+ years of clinical experience. · View source data at BLS.gov