Plumber Salary in New London, CT: $78,361 (2026)
Quick Answer:A full-time plumber in New London, CT earns a median $78,361/year (≈ $37.68/hour) in nominal terms for 2026 — projected from BLS OEWS 2025 (SOC 47-2152). Once you factor in New London's price level (8% above national, BEA RPP 107.9), that paycheck buys what $72,624 would nationally. Nominal pay sits 1.0% below the Connecticut state average.
Based on BLS state-level estimates · View source
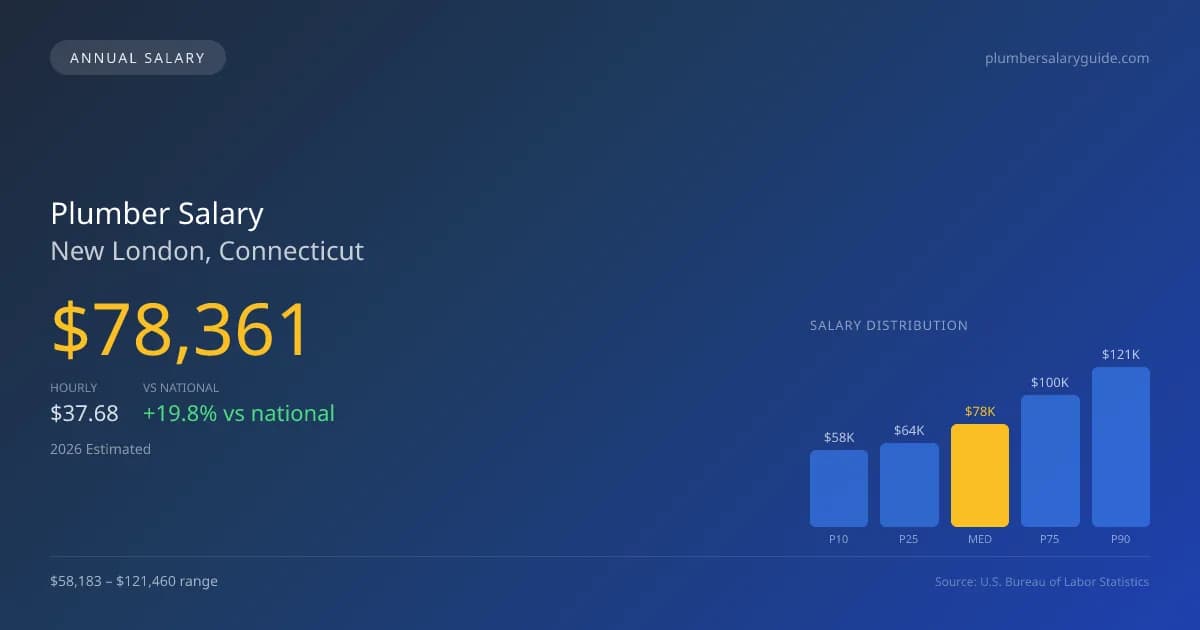
In 2026, plumbers in New London, Connecticut, can expect a median annual salary of $78,361, a figure that significantly exceeds the national median of $65,408, delivering a robust 19.80% premium for local professionals. The salary range showcases considerable variability, from $58,183 at the lower end (P10) to $121,460 at the upper echelon (P90), indicating the strength of both union and non-union roles. The data, derived from 2025 BLS estimates and adjusted for regional price parities, shows that a substantial pay gap exists between UA union pipefitters, who often command higher wages, and non-union service plumbers. With such a dynamic landscape influencing plumber pay in New London CT, understanding the nuances of this market becomes essential for both apprentices and experienced professionals alike.
About the New London Market
Salary estimated from Connecticut average ($74,000) adjusted for local cost of living.
Salary Breakdown
| Percentile | Annual | Hourly |
|---|---|---|
| Entry Level (P10) | $58,183 | $27.98 |
| Lower Range (P25) | $63,924 | $30.74 |
| Median (P50)(typical) | $78,361 | $37.68 |
| Upper Range (P75) | $100,302 | $48.23 |
| Top Earners (P90) | $121,460 | $58.40 |
Median Salary Position
19.80% above the national average
2026 Salary Percentile Distribution in New London
In New London, CT, the plumber salary spread from the 10th to 90th percentile is $63,277 (2026 est.). At $78,361, the local median is 19.8% above the national median of $65,408.
Salary Calculator
At 40 hours/week in New London: You'd be in the lower-middle range
How New London Plumber Pay Compares
New London median: $78,361/year (2026)
| Compared To | Median Salary | New London Pays |
|---|---|---|
| Connecticut Average | $79,153 | -1.00% less |
| National Average | $65,408 | +19.80% more |
Plumbers in New London, CT earn a median of $78,361 per year (2026 est.), which is 19.80% higher than the national median of $65,408 and 1.00% below the Connecticut state average of $79,153.
Cost-of-Living Adjusted Salary
New London has a cost of living 7.90% above the national average.
Adjusted salary = nominal × (100 / CoL index). CoL index: 100 = national average.
New London, CT has a cost-of-living index of 107.9 (above the national average of 100). While the nominal salary of $78,361 is competitive, the higher cost of living reduces purchasing power to an effective $72,624 — a 7.32% reduction.
Compare Purchasing Power
Select a city to see how your salary compares after cost of living
Select a city above to compare purchasing power
2019 BLS Actual
$66,084
2025 BLS Actual
$76,435
2026 Current Est.
$78,361
2019–2027 Growth
+21.6%
Salary Trajectory for Plumbers in New London (2019–2027)
2019–2025: actual BLS OEWS data for this metro area. 2026+: CAGR 2.52% projection.
| Year | Annual Salary | Status |
|---|---|---|
| 2019 | $66,084 | Actual |
| 2020 | $67,486 | Actual |
| 2021 | $71,739 | Actual |
| 2022 | $71,990 | Actual |
| 2023 | $73,739 | Actual |
| 2024 | $76,902 | Actual |
| 2025 | $76,435 | Actual |
| 2026(current) | $78,361 | Estimated |
| 2027 | $80,336 | Projected |
Based on 7 years of BLS OEWS data for the New London metropolitan area, the median plumber salary grew 15.7% from $66,084 (2019) to $76,435 (2025). At a 2.52% compound annual growth rate, salaries are projected to reach $80,336 by 2027 — a total increase of $14,252 (21.57%) from 2019.
Note: Historical values (2019–2025) are actual BLS OEWS figures for the New London metropolitan area, sourced from annual Occupational Employment and Wage Statistics surveys. 2026–2026 figures are current estimates, and 2027 values are projections, calculated using a 2.52% CAGR derived from 7-year BLS historical data. Actual salaries may vary based on employer, experience, certifications, and local market conditions.
Salary by Experience Level
| Experience | Estimated Salary Range |
|---|---|
| 0-2 years (New Graduate) | $58,183 – $63,924 |
| 3-5 years (Mid Career) | $63,924 – $78,361 |
| 5+ years (Experienced) | $78,361 – $100,302 |
| 10+ years (Top Earner) | $100,302 – $121,460 |
Plumber salary ranges estimated from BLS percentile data. Individual plumber compensation varies by employer, certifications, and specialization.
Plumber Job Market in New London
In terms of job availability, New London employs a modest number of plumbers, with just five individuals in this field, indicating a specialized but competitive market landscape. The local cost of living, reflected in a 107.9 index, suggests that while salaries may be higher, the increased living expenses also must be factored into take-home income. Union plumbing contractors, particularly those affiliated with the United Association, typically offer the highest compensation, followed by specialty roles, such as medical gas technicians, which demand additional certifications. In contrast, non-union contractors and service companies can provide variable income through commissions, though they often have lower base salaries. To maximize earnings, plumbers should consider obtaining advanced licenses, specializing in high-demand areas, and factoring in overtime opportunities, particularly in New London’s competitive plumbing market.
More salary data for New London, CT:
Frequently Asked Questions
How much do plumbers make in New London, CT in 2026?
Is New London, CT a good place to work as a plumber?
Can plumbers make $100K in New London?
What is the cost-of-living adjusted plumber salary in New London?
How much does a plumber make per hour in New London?
Related Pages
Compare Salaries
Career Resources
Nearby Cities in Connecticut
Written by Samuel Torres, CWP
Career Analyst
Samuel Torres has 10 years of experience in plumbing. He specializes in residential plumbing systems. He has worked with several home improvement companies.
Methodology & Data Source
Salary figures on this page are 2026 projections based on the Bureau of Labor Statistics Occupational Employment and Wage Statistics (OEWS) survey, May 2026 release. The BLS reported a median annual salary of $76,435 for plumbersin the New London metropolitan area. A 2.52% compound annual growth rate (CAGR), calculated from 6-year national BLS wage trends, was applied to project current 2026 compensation. Percentile ranges (P10–P90) represent the full salary distribution across experience levels and practice settings in this market.
Data Sources & Methodology
Salary data for New London is estimated from official BLS state-level occupational wage data (2025), adjusted for regional cost-of-living differences using BEA RPP (Regional Price Parities).
2026 figures are projected from 2025 BLS data using a compound annual growth rate (CAGR) of 2.52%, derived from historical BLS wage trends for plumbers (SOC 47-2152).
Compiled and verified by Samuel Torres, CWP, a licensed plumber with 10+ years of clinical experience. · View source data at BLS.gov