Plumber Salary in Connecticut: $79,554 (2026)
Quick Answer:Across Connecticut's 29 metropolitan areas, the average median plumber pay sits at $79,554/year heading into 2026 — a figure projected from 2025 BLS OEWS wage data for SOC 47-2152. Because Connecticut sits at BEA RPP 107.9 (8% above the U.S. baseline), that statewide median translates to roughly $73,729 in nationally-comparable purchasing power. Highest-paying metros: Bridgeport ($79,700), Stamford ($78,632), Shelton ($78,470).
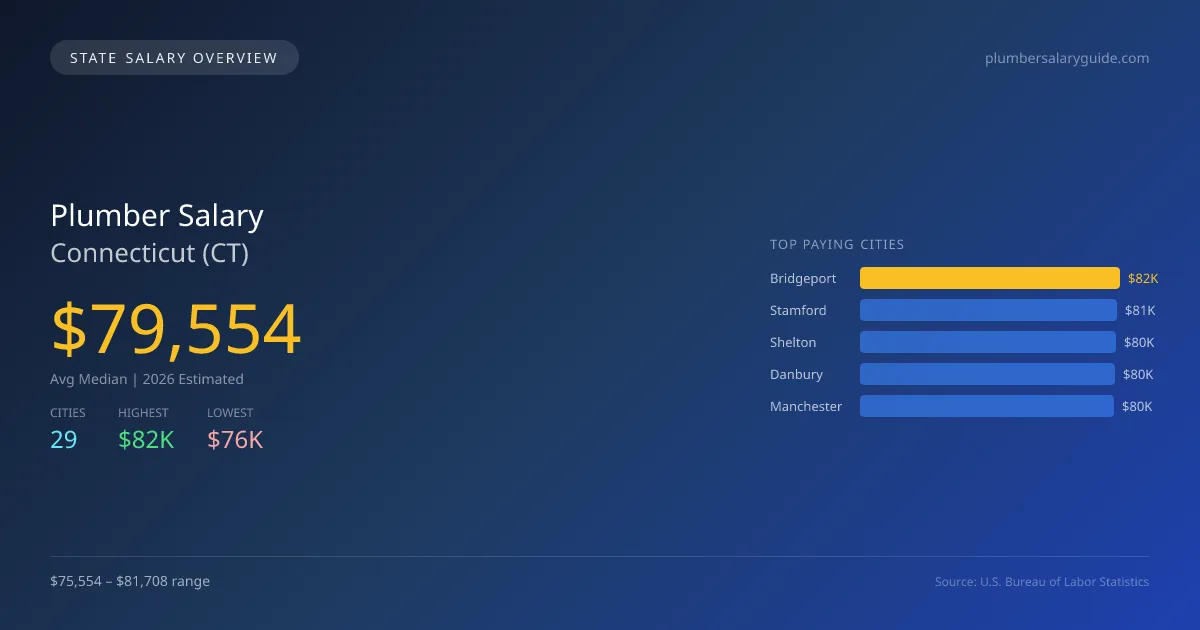
In 2026, the average median salary for plumbers in Connecticut is projected to be $79,554, significantly higher than the national median of $65,408, representing a 21.6% increase. The highest-paying city is Bridgeport at $81,708, while the lowest is Cheshire at $75,554, resulting in a salary gap of $6,154. This difference is influenced by various factors, including the cost of living, demand for skilled labor, and local market conditions. Connecticut has specific state licensing requirements and scope of practice laws that can affect earnings. Plumbers must obtain a license to practice, which requires a combination of experience and examinations, leading to a well-qualified workforce. The growing infrastructure needs and population growth also drive demand for plumbing services, contributing to an expected 2.52% annual growth rate in employment from 2025. With a total of 5,420 plumbers employed across 29 metro areas, the job market shows positive indicators for the coming years. Major cities like Stamford, Shelton, Danbury, and Manchester present competitive salaries and opportunities for career advancement, further solidifying the strength of the plumbing profession in Connecticut.
Connecticut Plumber Salary Range
Overall salary range in Connecticut: $44,350 (lowest entry-level) to $124,951 (highest top earner)
Connecticut vs National Average
Connecticut plumbers earn 21.63% more than the national median (+$14,146/year difference).
Connecticut Plumber Salary Distribution (2026)
Plumber salaries in Connecticut range from $47,122 (entry-level, 10th percentile) to $108,527 (top earners, 90th percentile), with a median of $79,554. The Connecticut median is $14,146 above the US national median of $65,408. The average hourly rate is $38.25/hr. Approximately 5,420 plumbers are employed across 29 cities.
2019 BLS Actual
$66,484
2025 BLS Actual
$77,599
2026 Current Est.
$79,554
2019–2027 Growth
+22.7%
Salary Trajectory for Plumbers in Connecticut (2019–2027)
2019–2025: actual BLS OEWS data for this metro area. 2026+: CAGR 2.52% projection.
| Year | Annual Salary | Status |
|---|---|---|
| 2019 | $66,484 | Actual |
| 2020 | $68,407 | Actual |
| 2021 | $68,811 | Actual |
| 2022 | $73,372 | Actual |
| 2023 | $65,741 | Actual |
| 2024 | $70,991 | Actual |
| 2025 | $77,599 | Actual |
| 2026(current) | $79,554 | Estimated |
| 2027 | $81,559 | Projected |
Based on 7 years of BLS OEWS data for the Connecticut metropolitan area, the median plumber salary grew 16.7% from $66,484 (2019) to $77,599 (2025). At a 2.52% compound annual growth rate, salaries are projected to reach $81,559 by 2027 — a total increase of $15,075 (22.67%) from 2019.
Note: Historical values (2019–2025) are actual BLS OEWS figures for the Connecticut metropolitan area, sourced from annual Occupational Employment and Wage Statistics surveys. 2026–2026 figures are current estimates, and 2027 values are projections, calculated using a 2.52% CAGR derived from 7-year BLS historical data. Actual salaries may vary based on employer, experience, certifications, and local market conditions.
Top 5 Highest Paying Cities in Connecticut
Lowest Paying Cities in Connecticut
| City | Median Salary |
|---|---|
| Cheshire | $75,554 |
| Enfield | $75,723 |
| Naugatuck | $75,831 |
| Glastonbury | $76,371 |
| Vernon | $76,396 |
Best Value Cities for Plumbers in Connecticut
When adjusted for local cost of living, these Connecticut cities offer the most purchasing power for plumbers.
| City | Nominal Salary | CoL Index | Adjusted Salary |
|---|---|---|---|
| Waterbury | $78,817 | 99.778 | $78,992 |
| Norwich | $78,920 | 100.445 | $78,570 |
| Hartford | $79,135 | 102.746 | $77,020 |
| Bridgeport | $81,708 | 106.864 | $76,460 |
| New Haven | $79,576 | 104.559 | $76,106 |
Adjusted salary = nominal salary × (100 / CoL index). CoL index: 100 = national average. Lower index = lower cost of living.
Salary by Experience Level in Connecticut
| Experience Level | Estimated Annual |
|---|---|
| Entry Level (0-2 years) | $47,122 |
| Mid Career (3-7 years) | $79,554 |
| Experienced (7+ years) | $108,527 |
Estimates based on BLS percentile data averaged across Connecticut metro areas. Individual pay varies by employer, certifications, and specialization.
All 29 Cities in Connecticut
| # | City | Median Salary |
|---|---|---|
| 1 | Bridgeport | $81,708 |
| 2 | Stamford | $80,614 |
| 3 | Shelton | $80,447 |
| 4 | Danbury | $79,999 |
| 5 | Manchester | $79,808 |
| 6 | New Haven | $79,576 |
| 7 | Hartford | $79,135 |
| 8 | Norwich | $78,920 |
| 9 | Waterbury | $78,817 |
| 10 | Norwalk | $78,755 |
| 11 | Bristol | $78,504 |
| 12 | Stratford | $78,391 |
| 13 | New London | $78,361 |
| 14 | Middletown | $78,293 |
| 15 | Meriden | $78,127 |
| 16 | Hamden | $77,871 |
| 17 | Fairfield | $77,815 |
| 18 | East Hartford | $77,777 |
| 19 | New Britain | $77,727 |
| 20 | Milford | $77,376 |
| 21 | West Haven | $77,344 |
| 22 | West Hartford | $77,232 |
| 23 | Torrington | $76,967 |
| 24 | Groton | $76,709 |
| 25 | Vernon | $76,396 |
| 26 | Glastonbury | $76,371 |
| 27 | Naugatuck | $75,831 |
| 28 | Enfield | $75,723 |
| 29 | Cheshire | $75,554 |
More Connecticut Salary Data
Explore More Plumber Salary Data
Frequently Asked Questions
How much do plumbers make in Connecticut in 2026?
What is the highest paying city for plumbers in Connecticut?
How does Connecticut plumber pay compare to the national average?
What is the entry-level plumber salary in Connecticut?
How many plumbers are employed in Connecticut?
Which Connecticut city offers the best value for plumbers?
Written by Samuel Torres, CWP
Career Analyst
Samuel Torres has 10 years of experience in plumbing. He specializes in residential plumbing systems. He has worked with several home improvement companies.
Methodology & Data Source
Statewide salary figures on this page are 2026 projections based on the Bureau of Labor Statistics Occupational Employment and Wage Statistics (OEWS) survey, May 2026 release. A 2.52% compound annual growth rate (CAGR), derived from 6-year national BLS wage trends, was applied to each metro area's reported salary to estimate current 2026 plumber compensation across Connecticut. State averages are employment-weighted across 29 metro areas — larger metro areas with more plumberscontribute proportionally more to the average, producing figures that better reflect typical compensation. Individual pay varies by city, employer, certifications, and experience.
Data Sources & Methodology
Source: BLS, OEWS, 7-year dataset (–). Per-city data from annual BLS metropolitan area surveys.
2026 figures are projected from 2025 BLS data using a compound annual growth rate (CAGR) of 2.52%, derived from historical BLS wage trends for plumbers (SOC 47-2152).
Compiled and verified by Samuel Torres, CWP, a licensed plumber with 10+ years of clinical experience. · View source data at BLS.gov