Plumber Hourly Pay in Woodbridge, VA: $26.78 (2026)
Quick Answer:Hourly pay for a plumber working in Woodbridge, VA runs $26.78 at the median for 2026 — annualizing to $55,695 at a standard 2,080-hour year. Figures projected from BLS OEWS 2025 (SOC 47-2152). Weighted against Woodbridge's regional price level (BEA RPP 103.2, 3% above national), each hour of work buys what $25.95 nationally would. A 24-hour part-time schedule grosses $33,419 per year.
Based on BLS state-level estimates · View source
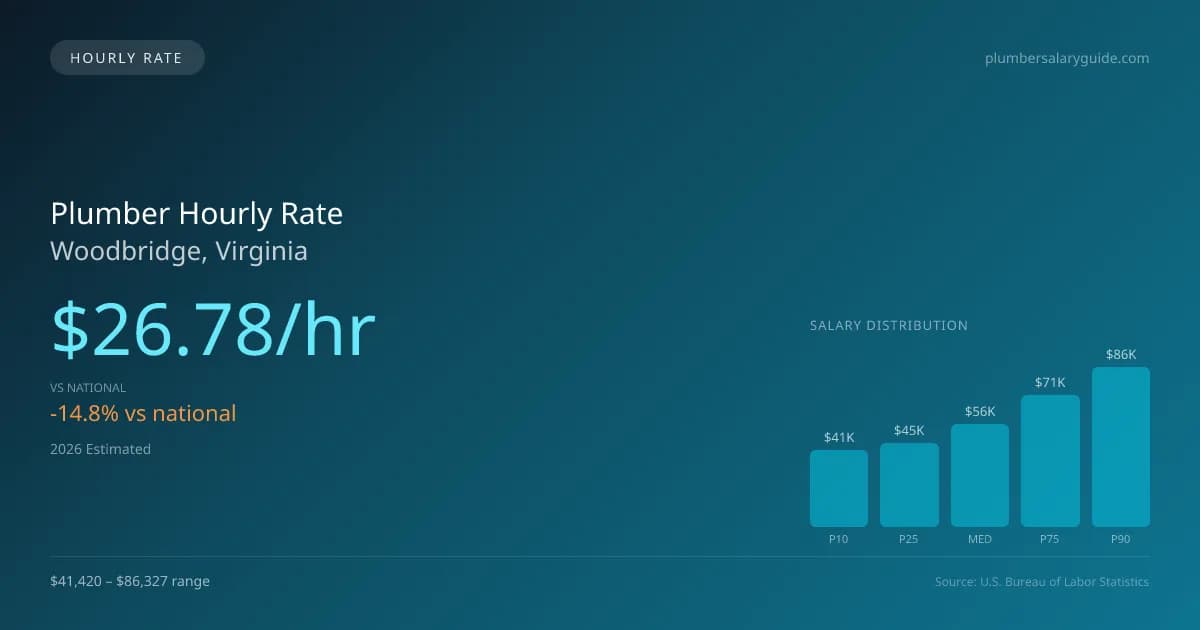
In Woodbridge, plumbers earn a median hourly rate of $26.78, which falls significantly below the national median of $31.45. This disparity can affect part-time and per-diem workers who might frequent commercial and residential sites, such as service calls to homes or plumbing needs in medical facilities. Those working part-time, for example three days a week, will find themselves earning less compared to full-time counterparts, but they can still capitalize on opportunities in diverse settings like manufacturing plants or sewer line projects. Junior plumbers can expect to start around the $19.91 mark, while highly experienced individuals may command upwards of $41.50 per hour, reflecting their expertise and the demand for skilled trades in this area.
About the Woodbridge Market
Salary estimated from Virginia average ($60,000) adjusted for local cost of living.
Plumber Hourly Wage Breakdown
| Percentile | Hourly Rate | Per 8hr Shift |
|---|---|---|
| Entry Level (P10) | $19.91 | $159.28 |
| Lower Range (P25) | $21.79 | $174.28 |
| Median (P50) | $26.78 | $214.23 |
| Upper Range (P75) | $34.27 | $274.18 |
| Top Earners (P90) | $41.50 | $332.00 |
Estimated Annual Income by Work Schedule in Woodbridge
Based on $26.78/hr median hourly rate · 2026 est.
At $26.78/hr, a plumber working full-time (40 hr/wk) in Woodbridge, VA can expect to earn approximately $55,699 per year (2026 est.). Part-time hygienists working 24 hours per week would earn around $32,134. With a cost-of-living index of 103.20 (above the national average), these earnings may be offset by higher expenses in Woodbridge.
Hourly Rate Calculator
Schedule Comparison in Woodbridge
| Schedule | Weekly | Monthly | Annual |
|---|---|---|---|
| Full-Time (40 hrs) | $1,071.13 | $4,642 | $55,699 |
| Part-Time (24 hrs) | $642.68 | $2,785 | $33,419 |
| Per Diem (16 hrs) | $428.45 | $1,857 | $22,279 |
Compare Plumber Wages With Similar Roles
| Role | Median Hourly |
|---|---|
| Plumber (Woodbridge) | $26.78 |
| Electrician (National Avg) | $31.97 |
| HVAC Technician (National Avg) | $28.47 |
| Pipefitter / Steamfitter (National Avg) | $32.85 |
| Construction Laborer (National Avg) | $22.95 |
Plumbers in Woodbridge, VA earn a median of $55,695 per year (2026 est.), which is 14.85% lower than the national median of $65,408 and 3.90% below the Virginia state average of $57,955.
Plumber Hourly Pay vs. Cost of Living
Working 24h/week at $26.78/hr = $33,419/year (purchasing power: $32,383).
Working 40h/week (full-time) = $55,699/year (purchasing power: $53,972).
CoL index: 103.2 (100 = national average).
2019 BLS Actual
$22.58/hr
2025 BLS Actual
$26.12/hr
2026 Current Est.
$26.78/hr
2019–2027 Growth
+21.6%
Hourly Rate Trajectory for Plumbers in Woodbridge (2019–2027)
2019–2025: actual BLS OEWS data for this metro area. 2026+: CAGR 2.52% projection.
| Year | Hourly Rate | Status |
|---|---|---|
| 2019 | $22.58/hr | Actual |
| 2020 | $23.06/hr | Actual |
| 2021 | $24.52/hr | Actual |
| 2022 | $24.60/hr | Actual |
| 2023 | $25.20/hr | Actual |
| 2024 | $28.62/hr | Actual |
| 2025 | $26.12/hr | Actual |
| 2026(current) | $26.78/hr | Estimated |
| 2027 | $27.45/hr | Projected |
Based on 7 years of BLS OEWS metropolitan area data, the median hourly rate for plumbers in Woodbridge grew 15.7% from $22.58/hr (2019) to $26.12/hr (2025). At a 2.52% projected growth rate, hourly pay is expected to reach $27.45/hr by 2027. Part-time and per-diem plumbers can use this multi-year trend to benchmark future contract negotiations.
Note: Historical values (2019–2025) are actual BLS OEWS figures for the Woodbridge metropolitan area, sourced from annual Occupational Employment and Wage Statistics surveys. 2026–2026 figures are current estimates, and 2027 values are projections, calculated using a 2.52% CAGR derived from 7-year BLS historical data. Actual salaries may vary based on employer, experience, certifications, and local market conditions.
Working as an Hourly Plumber in Woodbridge
When considering part-time arrangements, working 24 hours a week could yield a plumber annual pay that remains competitive, yet it strictly depends on the number of jobs they undertake. For more financially flexible opportunities, per-diem plumber pay in Woodbridge varies, especially for travel roles where rates can range between $100 to $175 daily, in addition to an hourly base of $40-$65. Self-employed plumbers can often charge effective rates of $100-$180 an hour in high cost of living (HCOL) markets like Woodbridge. Different employers also play a role in setting hourly wages; union plumbing contractors offer higher premiums compared to non-union counterparts. Meanwhile, factors such as health benefits can influence a plumber’s decision to accept lower hourly rates, as tradespeople must weigh the direct monetary compensation against long-term security. Negotiation becomes a vital skill in this context, particularly in a competitive market where understanding hourly expectations and total value, including benefits, can lead to more favorable terms.
More salary data for Woodbridge, VA:
Frequently Asked Questions
What is the hourly rate for plumbers in Woodbridge in 2026?
How much do part-time plumbers make in Woodbridge?
Are plumbers in Woodbridge paid hourly or salary?
How much does a full-time plumber make per year in Woodbridge?
Do plumbers earn more per hour working part-time in Woodbridge?
Related Pages
Compare Salaries
Career Resources
Nearby Cities in Virginia
Written by Samuel Torres, CWP
Career Analyst
Samuel Torres has 10 years of experience in plumbing. He specializes in residential plumbing systems. He has worked with several home improvement companies.
Methodology & Data Source
Hourly wage figures on this page are 2026 projections based on the Bureau of Labor Statistics Occupational Employment and Wage Statistics (OEWS) survey, May 2026 release. A 2.52% compound annual growth rate (CAGR), derived from 6-year national BLS wage trends, was applied to estimate current 2026 hourly rates for plumbers in Woodbridge. Part-time and full-time income estimates assume consistent weekly hours and do not account for overtime, benefits, or seasonal variation.
Data Sources & Methodology
Salary data for Woodbridge is estimated from official BLS state-level occupational wage data (2025), adjusted for regional cost-of-living differences using BEA RPP (Regional Price Parities).
2026 figures are projected from 2025 BLS data using a compound annual growth rate (CAGR) of 2.52%, derived from historical BLS wage trends for plumbers (SOC 47-2152).
Compiled and verified by Samuel Torres, CWP, a licensed plumber with 10+ years of clinical experience. · View source data at BLS.gov