Plumber Salary in Virginia: $61,781 (2026)
Quick Answer:Across Virginia's 42 metropolitan areas, the average median plumber pay sits at $61,781/year heading into 2026 — a figure projected from 2025 BLS OEWS wage data for SOC 47-2152. Because Virginia sits at BEA RPP 103.2 (3% above the U.S. baseline), that statewide median translates to roughly $59,865 in nationally-comparable purchasing power. Highest-paying metros: Alexandria ($71,254), Norfolk ($62,793), Chesapeake ($62,110).
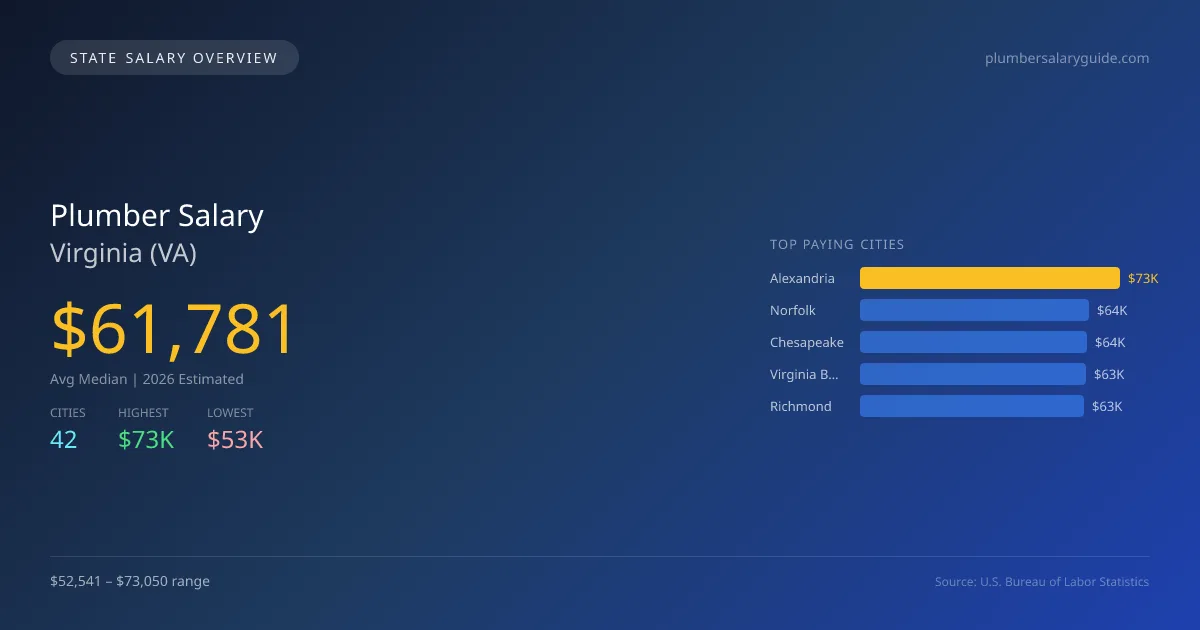
In 2026, the average median salary for plumbers in Virginia is projected to be $61,782, which is 5.5% lower than the national median of $65,408. The highest-paying city in the state is Alexandria, where plumbers can expect to earn around $73,050, while Staunton offers the lowest salaries at approximately $52,541. This salary disparity is influenced by several factors, including the cost of living and demand for plumbing services in different regions. Virginia's specific job market is shaped by state licensing requirements, which mandate that plumbers obtain a state-issued license, ensuring that professionals meet established standards. The scope of practice laws also delineate the types of plumbing work that can be performed, influencing both job prospects and salary levels. With a projected annual growth rate of 2.52%, the plumbing sector in Virginia shows a steady demand trajectory, supported by ongoing residential and commercial development. As the state continues to expand, particularly in metropolitan areas like Norfolk and Chesapeake, opportunities for employment and salary advancement for plumbers are expected to remain strong. Overall, the outlook for plumbers in Virginia presents a balanced mix of opportunity and competition, particularly in its larger urban centers.
Virginia Plumber Salary Range
Overall salary range in Virginia: $37,868 (lowest entry-level) to $113,227 (highest top earner)
Virginia vs National Average
Virginia plumbers earn 5.55% less than the national median ($-3,627/year difference).
Virginia Plumber Salary Distribution (2026)
Plumber salaries in Virginia range from $45,171 (entry-level, 10th percentile) to $78,290 (top earners, 90th percentile), with a median of $61,781. The Virginia median is $3,627 below the US national median of $65,408. The average hourly rate is $29.71/hr. Approximately 9,540 plumbers are employed across 42 cities.
2019 BLS Actual
$50,596
2025 BLS Actual
$60,263
2026 Current Est.
$61,781
2019–2027 Growth
+25.2%
Salary Trajectory for Plumbers in Virginia (2019–2027)
2019–2025: actual BLS OEWS data for this metro area. 2026+: CAGR 2.52% projection.
| Year | Annual Salary | Status |
|---|---|---|
| 2019 | $50,596 | Actual |
| 2020 | $51,697 | Actual |
| 2021 | $48,522 | Actual |
| 2022 | $50,240 | Actual |
| 2023 | $56,201 | Actual |
| 2024 | $59,036 | Actual |
| 2025 | $60,263 | Actual |
| 2026(current) | $61,781 | Estimated |
| 2027 | $63,338 | Projected |
Based on 7 years of BLS OEWS data for the Virginia metropolitan area, the median plumber salary grew 19.1% from $50,596 (2019) to $60,263 (2025). At a 2.52% compound annual growth rate, salaries are projected to reach $63,338 by 2027 — a total increase of $12,742 (25.18%) from 2019.
Note: Historical values (2019–2025) are actual BLS OEWS figures for the Virginia metropolitan area, sourced from annual Occupational Employment and Wage Statistics surveys. 2026–2026 figures are current estimates, and 2027 values are projections, calculated using a 2.52% CAGR derived from 7-year BLS historical data. Actual salaries may vary based on employer, experience, certifications, and local market conditions.
Top 5 Highest Paying Cities in Virginia
Lowest Paying Cities in Virginia
| City | Median Salary |
|---|---|
| Staunton | $52,541 |
| Roanoke | $53,003 |
| Falls Church | $53,419 |
| Harrisonburg | $53,608 |
| Herndon | $54,269 |
Best Value Cities for Plumbers in Virginia
When adjusted for local cost of living, these Virginia cities offer the most purchasing power for plumbers.
| City | Nominal Salary | CoL Index | Adjusted Salary |
|---|---|---|---|
| Alexandria | $73,050 | 103.2 | $70,785 |
| Lynchburg | $58,652 | 89.363 | $65,633 |
| Virginia Beach | $63,429 | 97.941 | $64,762 |
| Richmond | $63,029 | 97.858 | $64,409 |
| Norfolk | $64,375 | 103.2 | $62,379 |
Adjusted salary = nominal salary × (100 / CoL index). CoL index: 100 = national average. Lower index = lower cost of living.
Salary by Experience Level in Virginia
| Experience Level | Estimated Annual |
|---|---|
| Entry Level (0-2 years) | $45,171 |
| Mid Career (3-7 years) | $61,781 |
| Experienced (7+ years) | $78,290 |
Estimates based on BLS percentile data averaged across Virginia metro areas. Individual pay varies by employer, certifications, and specialization.
All 42 Cities in Virginia
| # | City | Median Salary |
|---|---|---|
| 1 | Alexandria | $73,050 |
| 2 | Norfolk | $64,375 |
| 3 | Chesapeake | $63,675 |
| 4 | Virginia Beach | $63,429 |
| 5 | Richmond | $63,029 |
| 6 | Bristol | $62,255 |
| 7 | Winchester | $59,216 |
| 8 | Lynchburg | $58,652 |
| 9 | Newport News | $58,385 |
| 10 | Charlottesville | $57,934 |
| 11 | Hampton | $57,869 |
| 12 | Centreville | $57,600 |
| 13 | Burke | $57,210 |
| 14 | Suffolk | $56,962 |
| 15 | Tuckahoe | $56,801 |
| 16 | Ashburn | $56,719 |
| 17 | McLean | $56,715 |
| 18 | Reston | $56,655 |
| 19 | Danville | $56,643 |
| 20 | Fredericksburg | $56,400 |
| 21 | Dale City | $56,389 |
| 22 | Manassas | $56,329 |
| 23 | Salem | $56,172 |
| 24 | Leesburg | $56,091 |
| 25 | Portsmouth | $56,059 |
| 26 | Mechanicsville | $55,969 |
| 27 | Springfield | $55,771 |
| 28 | Woodbridge | $55,695 |
| 29 | Radford | $55,640 |
| 30 | Sterling | $55,587 |
| 31 | Lake Ridge | $55,515 |
| 32 | Linton Hall | $55,452 |
| 33 | Fairfax | $55,310 |
| 34 | Waynesboro | $55,040 |
| 35 | Annandale | $54,966 |
| 36 | Williamsburg | $54,861 |
| 37 | Blacksburg | $54,684 |
| 38 | Herndon | $54,269 |
| 39 | Harrisonburg | $53,608 |
| 40 | Falls Church | $53,419 |
| 41 | Roanoke | $53,003 |
| 42 | Staunton | $52,541 |
More Virginia Salary Data
Compare Cities in Virginia
View all comparisons →Explore More Plumber Salary Data
Frequently Asked Questions
How much do plumbers make in Virginia in 2026?
What is the highest paying city for plumbers in Virginia?
How does Virginia plumber pay compare to the national average?
What is the entry-level plumber salary in Virginia?
How many plumbers are employed in Virginia?
Which Virginia city offers the best value for plumbers?
Written by Samuel Torres, CWP
Career Analyst
Samuel Torres has 10 years of experience in plumbing. He specializes in residential plumbing systems. He has worked with several home improvement companies.
Methodology & Data Source
Statewide salary figures on this page are 2026 projections based on the Bureau of Labor Statistics Occupational Employment and Wage Statistics (OEWS) survey, May 2026 release. A 2.52% compound annual growth rate (CAGR), derived from 6-year national BLS wage trends, was applied to each metro area's reported salary to estimate current 2026 plumber compensation across Virginia. State averages are employment-weighted across 42 metro areas — larger metro areas with more plumberscontribute proportionally more to the average, producing figures that better reflect typical compensation. Individual pay varies by city, employer, certifications, and experience.
Data Sources & Methodology
Source: BLS, OEWS, 7-year dataset (–). Per-city data from annual BLS metropolitan area surveys.
2026 figures are projected from 2025 BLS data using a compound annual growth rate (CAGR) of 2.52%, derived from historical BLS wage trends for plumbers (SOC 47-2152).
Compiled and verified by Samuel Torres, CWP, a licensed plumber with 10+ years of clinical experience. · View source data at BLS.gov