Plumber Hourly Pay in Norwich, CT: $37.94 (2026)
Quick Answer:Hourly pay for a plumber working in Norwich, CT runs $37.94 at the median for 2026 — annualizing to $78,920 at a standard 2,080-hour year. Figures projected from BLS OEWS 2025 (SOC 47-2152). Weighted against Norwich's regional price level (BEA RPP 100.4, 0% above national), each hour of work buys what $37.77 nationally would. A 24-hour part-time schedule grosses $47,352 per year.
Official BLS data · View source
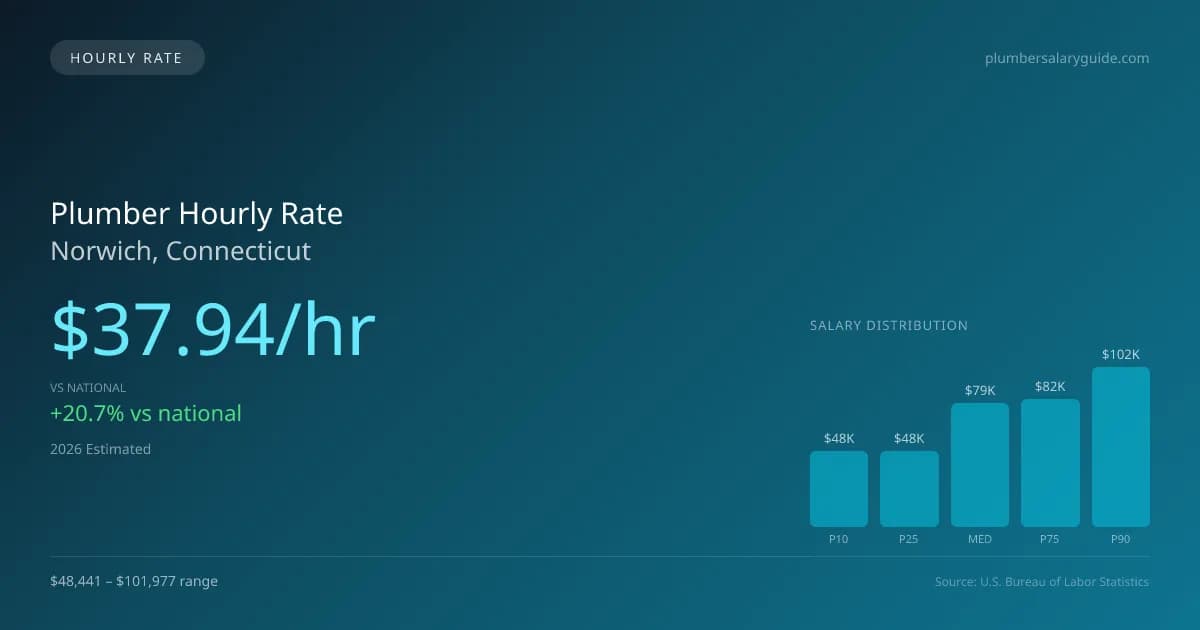
In Norwich, Connecticut, the projected plumber hourly pay for 2026 stands at $37.94, significantly higher than the national average hourly rate of $31.45. This attractive pay scale reflects the diverse environments where plumbers operate, including residential service calls, commercial construction sites, and specialized medical facilities. For part-time plumbers working three days a week, this hourly rate can translate into a respectable living, allowing them to engage in a range of work from fixing household plumbing to assisting in larger industrial or commercial projects. Entry-level plumbers in Norwich can expect to earn around $23.29 per hour, while seasoned professionals can push their hourly earnings as high as $49.03. According to estimates based on 2025 BLS data, projected to 2026, these numbers indicate a favorable earning potential in a profession facing consistent demand due to aging infrastructure and a skilled workforce shortage.
Plumber Hourly Wage Breakdown
| Percentile | Hourly Rate | Per 8hr Shift |
|---|---|---|
| Entry Level (P10) | $23.29 | $186.34 |
| Lower Range (P25) | $23.29 | $186.34 |
| Median (P50) | $37.94 | $303.54 |
| Upper Range (P75) | $39.23 | $313.88 |
| Top Earners (P90) | $49.03 | $392.20 |
Estimated Annual Income by Work Schedule in Norwich
Based on $37.94/hr median hourly rate · 2026 est.
At $37.94/hr, a plumber working full-time (40 hr/wk) in Norwich, CT can expect to earn approximately $78,921 per year (2026 est.). Part-time hygienists working 24 hours per week would earn around $45,531. With a cost-of-living index of 100.44 (above the national average), these earnings may be offset by higher expenses in Norwich.
Hourly Rate Calculator
Schedule Comparison in Norwich
| Schedule | Weekly | Monthly | Annual |
|---|---|---|---|
| Full-Time (40 hrs) | $1,517.71 | $6,577 | $78,921 |
| Part-Time (24 hrs) | $910.62 | $3,946 | $47,352 |
| Per Diem (16 hrs) | $607.08 | $2,631 | $31,568 |
Compare Plumber Wages With Similar Roles
| Role | Median Hourly |
|---|---|
| Plumber (Norwich) | $37.94 |
| Electrician (National Avg) | $31.97 |
| HVAC Technician (National Avg) | $28.47 |
| Pipefitter / Steamfitter (National Avg) | $32.85 |
| Construction Laborer (National Avg) | $22.95 |
Plumbers in Norwich, CT earn a median of $78,920 per year (2026 est.), which is 20.66% higher than the national median of $65,408 and 0.30% below the Connecticut state average of $79,157.
Plumber Hourly Pay vs. Cost of Living
Working 24h/week at $37.94/hr = $47,352/year (purchasing power: $47,143).
Working 40h/week (full-time) = $78,921/year (purchasing power: $78,571).
CoL index: 100.445 (100 = national average).
2019 BLS Actual
$27.51/hr
2025 BLS Actual
$37.01/hr
2026 Current Est.
$37.94/hr
2019–2027 Growth
+41.4%
Hourly Rate Trajectory for Plumbers in Norwich (2019–2027)
2019–2025: actual BLS OEWS data for this metro area. 2026+: CAGR 2.52% projection.
| Year | Hourly Rate | Status |
|---|---|---|
| 2019 | $27.51/hr | Actual |
| 2020 | $29.82/hr | Actual |
| 2021 | $29.91/hr | Actual |
| 2022 | $33.23/hr | Actual |
| 2023 | $28.99/hr | Actual |
| 2024 | $31.67/hr | Actual |
| 2025 | $37.01/hr | Actual |
| 2026(current) | $37.94/hr | Estimated |
| 2027 | $38.90/hr | Projected |
Based on 7 years of BLS OEWS metropolitan area data, the median hourly rate for plumbers in Norwich grew 34.5% from $27.51/hr (2019) to $37.01/hr (2025). At a 2.52% projected growth rate, hourly pay is expected to reach $38.90/hr by 2027. Part-time and per-diem plumbers can use this multi-year trend to benchmark future contract negotiations.
Note: Historical values (2019–2025) are actual BLS OEWS figures for the Norwich metropolitan area, sourced from annual Occupational Employment and Wage Statistics surveys. 2026–2026 figures are current estimates, and 2027 values are projections, calculated using a 2.52% CAGR derived from 7-year BLS historical data. Actual salaries may vary based on employer, experience, certifications, and local market conditions.
Working as an Hourly Plumber in Norwich
Considering part-time opportunities, a plumber working 24 hours weekly could potentially take home a significant annual income, though this amount would be markedly lower than that of a full-time counterpart. For plumbers in the field, per diem and agency roles represent another lucrative avenue; travel pipefitters and steamfitters can earn daily rates ranging from $100 to $175, in addition to their hourly base pay of $40 to $65. Many self-employed plumbers operating in high-cost-of-living areas like Norwich might see effective rates of $100 to $180 per hour. Hourly rates can also vary widely depending on the employer, with unionized positions offering a premium over non-union or self-employed roles due to additional benefits such as health insurance. When negotiating hourly pay, it’s essential to weigh the trade-offs of benefits versus higher pay without those entitlements, ensuring clear communication about your qualifications, such as UA affiliation, specialty credentials, or extensive experience in the plumbing sector.
More salary data for Norwich, CT:
Frequently Asked Questions
What is the hourly rate for plumbers in Norwich in 2026?
How much do part-time plumbers make in Norwich?
Are plumbers in Norwich paid hourly or salary?
How much does a full-time plumber make per year in Norwich?
Do plumbers earn more per hour working part-time in Norwich?
Related Pages
Compare Salaries
Career Resources
Nearby Cities in Connecticut
Written by Samuel Torres, CWP
Career Analyst
Samuel Torres has 10 years of experience in plumbing. He specializes in residential plumbing systems. He has worked with several home improvement companies.
Methodology & Data Source
Hourly wage figures on this page are 2026 projections based on the Bureau of Labor Statistics Occupational Employment and Wage Statistics (OEWS) survey, May 2026 release. A 2.52% compound annual growth rate (CAGR), derived from 6-year national BLS wage trends, was applied to estimate current 2026 hourly rates for plumbers in Norwich. Part-time and full-time income estimates assume consistent weekly hours and do not account for overtime, benefits, or seasonal variation.
Data Sources & Methodology
Source: BLS, OEWS, 7-year dataset (–). Per-city data from annual BLS metropolitan area surveys.
2026 figures are projected from 2025 BLS data using a compound annual growth rate (CAGR) of 2.52%, derived from historical BLS wage trends for plumbers (SOC 47-2152).
Compiled and verified by Samuel Torres, CWP, a licensed plumber with 10+ years of clinical experience. · View source data at BLS.gov