Plumber Salary in Wisconsin: $87,844 (2026)
Quick Answer:Across Wisconsin's 46 metropolitan areas, the average median plumber pay sits at $87,844/year heading into 2026 — a figure projected from 2025 BLS OEWS wage data for SOC 47-2152. Because Wisconsin sits at BEA RPP 93.4 (7% below the U.S. baseline), that statewide median translates to roughly $94,051 in nationally-comparable purchasing power. Highest-paying metros: Eau Claire ($92,720), Appleton ($91,750), Sheboygan ($91,530).
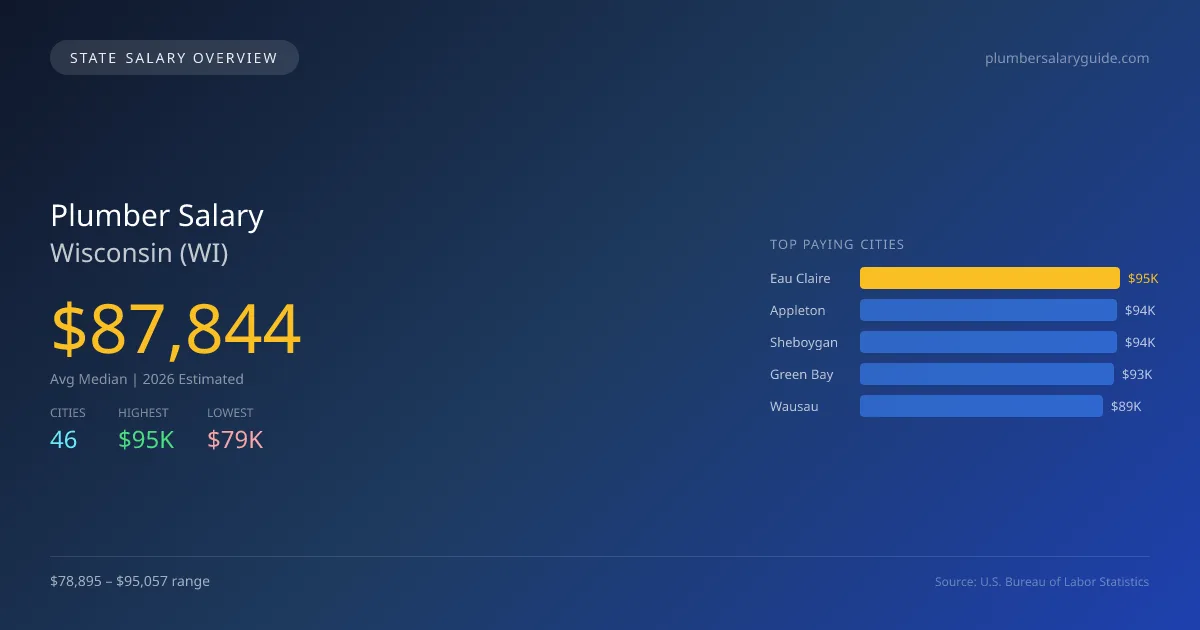
In 2026, the average median salary for plumbers in Wisconsin is projected to be $87,844, significantly higher than the national median of $65,408, representing a 34.3% increase. The highest paying city in the state is Eau Claire, with an average salary of $95,057, while Mount Pleasant offers the lowest at $78,895. This $16,162 salary gap can be attributed to various factors, including the cost of living, local demand for plumbing services, and competition for skilled workers in different regions. Wisconsin has specific licensing requirements and a defined scope of practice for plumbers, which can impact salary levels. Compliance with state regulations is essential and may lead to variations in job availability and salary depending on local market conditions. The demand for plumbing services is driven by infrastructure needs, population growth, and ongoing maintenance of existing systems. With a projected annual growth rate of 2.52%, the job market for plumbers in Wisconsin appears steady, with a total of 8,119 plumbers currently employed across the state. Other cities with competitive salaries include Appleton at $94,062, Sheboygan at $93,837, Green Bay at $92,852, and Wausau at $88,936, indicating a healthy landscape for individuals pursuing a plumbing career in Wisconsin.
Wisconsin Plumber Salary Range
Overall salary range in Wisconsin: $48,297 (lowest entry-level) to $136,289 (highest top earner)
Wisconsin vs National Average
Wisconsin plumbers earn 34.30% more than the national median (+$22,436/year difference).
Wisconsin Plumber Salary Distribution (2026)
Plumber salaries in Wisconsin range from $54,075 (entry-level, 10th percentile) to $123,175 (top earners, 90th percentile), with a median of $87,844. The Wisconsin median is $22,436 above the US national median of $65,408. The average hourly rate is $42.23/hr. Approximately 8,119 plumbers are employed across 46 cities.
2019 BLS Actual
$69,571
2025 BLS Actual
$85,685
2026 Current Est.
$87,844
2019–2027 Growth
+29.4%
Salary Trajectory for Plumbers in Wisconsin (2019–2027)
2019–2025: actual BLS OEWS data for this metro area. 2026+: CAGR 2.52% projection.
| Year | Annual Salary | Status |
|---|---|---|
| 2019 | $69,571 | Actual |
| 2020 | $67,773 | Actual |
| 2021 | $74,910 | Actual |
| 2022 | $72,807 | Actual |
| 2023 | $77,550 | Actual |
| 2024 | $84,536 | Actual |
| 2025 | $85,685 | Actual |
| 2026(current) | $87,844 | Estimated |
| 2027 | $90,058 | Projected |
Based on 7 years of BLS OEWS data for the Wisconsin metropolitan area, the median plumber salary grew 23.2% from $69,571 (2019) to $85,685 (2025). At a 2.52% compound annual growth rate, salaries are projected to reach $90,058 by 2027 — a total increase of $20,487 (29.45%) from 2019.
Note: Historical values (2019–2025) are actual BLS OEWS figures for the Wisconsin metropolitan area, sourced from annual Occupational Employment and Wage Statistics surveys. 2026–2026 figures are current estimates, and 2027 values are projections, calculated using a 2.52% CAGR derived from 7-year BLS historical data. Actual salaries may vary based on employer, experience, certifications, and local market conditions.
Top 5 Highest Paying Cities in Wisconsin
Lowest Paying Cities in Wisconsin
| City | Median Salary |
|---|---|
| Mount Pleasant | $78,895 |
| Racine | $79,012 |
| Fond du Lac | $79,258 |
| Kenosha | $79,289 |
| Wisconsin Rapids | $80,049 |
Best Value Cities for Plumbers in Wisconsin
When adjusted for local cost of living, these Wisconsin cities offer the most purchasing power for plumbers.
| City | Nominal Salary | CoL Index | Adjusted Salary |
|---|---|---|---|
| Eau Claire | $95,057 | 92.796 | $102,437 |
| Appleton | $94,062 | 92.419 | $101,778 |
| Sheboygan | $93,837 | 94.014 | $99,812 |
| Green Bay | $92,852 | 93.086 | $99,749 |
| Wausau | $88,936 | 92.651 | $95,990 |
Adjusted salary = nominal salary × (100 / CoL index). CoL index: 100 = national average. Lower index = lower cost of living.
Salary by Experience Level in Wisconsin
| Experience Level | Estimated Annual |
|---|---|
| Entry Level (0-2 years) | $54,075 |
| Mid Career (3-7 years) | $87,844 |
| Experienced (7+ years) | $123,175 |
Estimates based on BLS percentile data averaged across Wisconsin metro areas. Individual pay varies by employer, certifications, and specialization.
All 46 Cities in Wisconsin
| # | City | Median Salary |
|---|---|---|
| 1 | Eau Claire | $95,057 |
| 2 | Appleton | $94,062 |
| 3 | Sheboygan | $93,837 |
| 4 | Green Bay | $92,852 |
| 5 | Wausau | $88,936 |
| 6 | Oshkosh | $88,495 |
| 7 | Waukesha | $87,928 |
| 8 | West Allis | $87,377 |
| 9 | Madison | $87,306 |
| 10 | Milwaukee | $86,834 |
| 11 | Fitchburg | $86,798 |
| 12 | Greenfield | $86,790 |
| 13 | Menomonee Falls | $86,039 |
| 14 | Brookfield | $85,835 |
| 15 | Onalaska | $85,827 |
| 16 | West Bend | $85,788 |
| 17 | De Pere | $85,720 |
| 18 | New Berlin | $85,557 |
| 19 | Sun Prairie | $84,832 |
| 20 | La Crosse | $84,692 |
| 21 | Caledonia | $84,603 |
| 22 | Muskego | $84,419 |
| 23 | Stevens Point | $84,026 |
| 24 | Franklin | $83,931 |
| 25 | Oak Creek | $83,668 |
| 26 | Superior | $83,538 |
| 27 | Manitowoc | $83,497 |
| 28 | Pewaukee | $83,187 |
| 29 | South Milwaukee | $82,944 |
| 30 | Pleasant Prairie | $82,932 |
| 31 | Menomonie | $82,845 |
| 32 | Whitewater | $82,839 |
| 33 | Wauwatosa | $82,766 |
| 34 | Germantown | $82,708 |
| 35 | Marshfield | $82,675 |
| 36 | River Falls | $82,268 |
| 37 | Mequon | $81,592 |
| 38 | Platteville | $81,585 |
| 39 | Beloit | $81,247 |
| 40 | Janesville | $81,063 |
| 41 | Middleton | $80,718 |
| 42 | Wisconsin Rapids | $80,049 |
| 43 | Kenosha | $79,289 |
| 44 | Fond du Lac | $79,258 |
| 45 | Racine | $79,012 |
| 46 | Mount Pleasant | $78,895 |
More Wisconsin Salary Data
Explore More Plumber Salary Data
Frequently Asked Questions
How much do plumbers make in Wisconsin in 2026?
What is the highest paying city for plumbers in Wisconsin?
How does Wisconsin plumber pay compare to the national average?
What is the entry-level plumber salary in Wisconsin?
How many plumbers are employed in Wisconsin?
Which Wisconsin city offers the best value for plumbers?
Written by Samuel Torres, CWP
Career Analyst
Samuel Torres has 10 years of experience in plumbing. He specializes in residential plumbing systems. He has worked with several home improvement companies.
Methodology & Data Source
Statewide salary figures on this page are 2026 projections based on the Bureau of Labor Statistics Occupational Employment and Wage Statistics (OEWS) survey, May 2026 release. A 2.52% compound annual growth rate (CAGR), derived from 6-year national BLS wage trends, was applied to each metro area's reported salary to estimate current 2026 plumber compensation across Wisconsin. State averages are employment-weighted across 46 metro areas — larger metro areas with more plumberscontribute proportionally more to the average, producing figures that better reflect typical compensation. Individual pay varies by city, employer, certifications, and experience.
Data Sources & Methodology
Source: BLS, OEWS, 7-year dataset (–). Per-city data from annual BLS metropolitan area surveys.
2026 figures are projected from 2025 BLS data using a compound annual growth rate (CAGR) of 2.52%, derived from historical BLS wage trends for plumbers (SOC 47-2152).
Compiled and verified by Samuel Torres, CWP, a licensed plumber with 10+ years of clinical experience. · View source data at BLS.gov