Plumber Salary in Martinsburg, WV: $56,797 (2026)
Quick Answer:A full-time plumber in Martinsburg, WV earns a median $56,797/year (≈ $27.31/hour) in nominal terms for 2026 — projected from BLS OEWS 2025 (SOC 47-2152). Once you factor in Martinsburg's price level (13% below national, BEA RPP 86.5), that paycheck buys what $65,661 would nationally. Nominal pay sits 6.0% below the West Virginia state average.
Based on BLS state-level estimates · View source
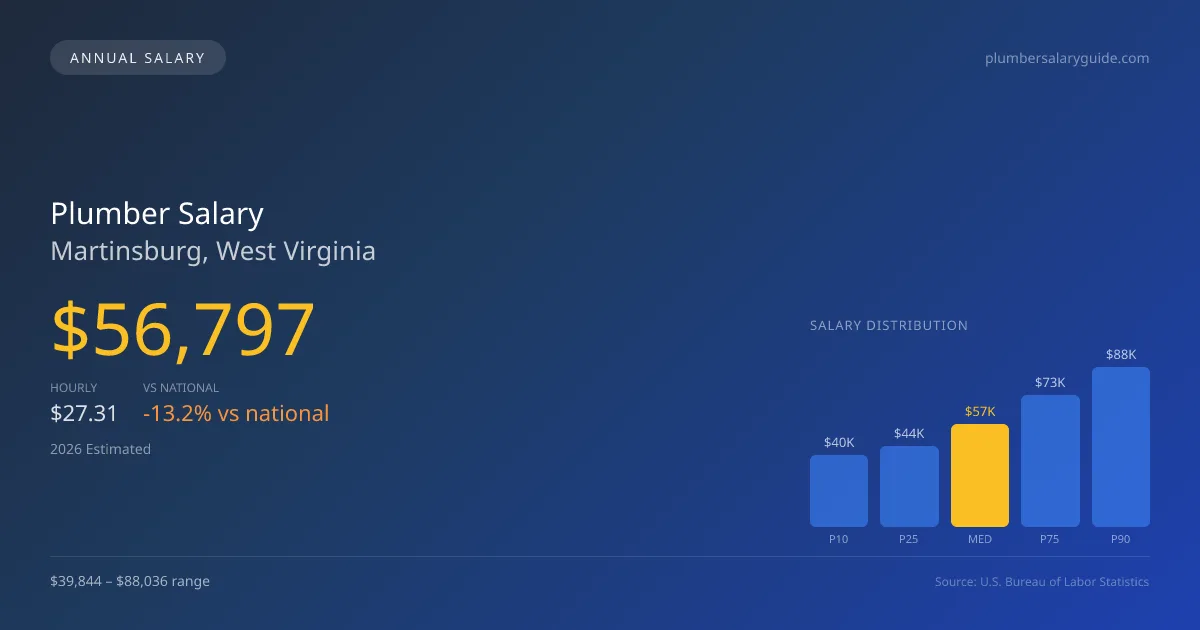
In 2026, the average plumber salary in Martinsburg, West Virginia, is projected at $56,797, reflecting a notable difference when compared to the national median of $65,408. Local estimates indicate a salary range from $39,844 at the lower tenth percentile (P10) to $88,036 at the upper ninetieth percentile (P90). Given the distinct nature of the Martinsburg market, the disparity in wages can largely be attributed to the influence of UA union pipefitters who typically secure higher pay rates compared to non-union service plumbers. This dynamic, along with adjustments for regional cost variances, frames a competitive landscape for those considering careers in plumbing within the area.
About the Martinsburg Market
Salary estimated from West Virginia average ($50,000) adjusted for local cost of living.
Salary Breakdown
| Percentile | Annual | Hourly |
|---|---|---|
| Entry Level (P10) | $39,844 | $19.16 |
| Lower Range (P25) | $44,395 | $21.34 |
| Median (P50)(typical) | $56,797 | $27.31 |
| Upper Range (P75) | $72,700 | $34.95 |
| Top Earners (P90) | $88,036 | $42.32 |
Median Salary Position
13.17% below the national average
2026 Salary Percentile Distribution in Martinsburg
In Martinsburg, WV, the plumber salary spread from the 10th to 90th percentile is $48,192 (2026 est.). At $56,797, the local median is 13.17% below the national median of $65,408.
Salary Calculator
At 40 hours/week in Martinsburg: You'd be in the lower-middle range
How Martinsburg Plumber Pay Compares
Martinsburg median: $56,797/year (2026)
| Compared To | Median Salary | Martinsburg Pays |
|---|---|---|
| West Virginia Average | $60,422 | -6.00% less |
| National Average | $65,408 | -13.17% less |
Plumbers in Martinsburg, WV earn a median of $56,797 per year (2026 est.), which is 13.17% lower than the national median of $65,408 and 6.00% below the West Virginia state average of $60,422.
Cost-of-Living Adjusted Salary
Martinsburg has a cost of living 13.50% below the national average, meaning your salary goes further here.
Adjusted salary = nominal × (100 / CoL index). CoL index: 100 = national average.
Martinsburg, WV has a cost-of-living index of 86.5 (below the national average of 100). A plumber earning $56,797 nominally has purchasing power equivalent to $65,661 in an average-cost city — an effective 15.61% boost.
Compare Purchasing Power
Select a city to see how your salary compares after cost of living
Select a city above to compare purchasing power
2019 BLS Actual
$47,898
2025 BLS Actual
$55,401
2026 Current Est.
$56,797
2019–2027 Growth
+21.6%
Salary Trajectory for Plumbers in Martinsburg (2019–2027)
2019–2025: actual BLS OEWS data for this metro area. 2026+: CAGR 2.52% projection.
| Year | Annual Salary | Status |
|---|---|---|
| 2019 | $47,898 | Actual |
| 2020 | $48,914 | Actual |
| 2021 | $51,997 | Actual |
| 2022 | $52,179 | Actual |
| 2023 | $53,447 | Actual |
| 2024 | $40,855 | Actual |
| 2025 | $55,401 | Actual |
| 2026(current) | $56,797 | Estimated |
| 2027 | $58,228 | Projected |
Based on 7 years of BLS OEWS data for the Martinsburg metropolitan area, the median plumber salary grew 15.7% from $47,898 (2019) to $55,401 (2025). At a 2.52% compound annual growth rate, salaries are projected to reach $58,228 by 2027 — a total increase of $10,330 (21.57%) from 2019.
Note: Historical values (2019–2025) are actual BLS OEWS figures for the Martinsburg metropolitan area, sourced from annual Occupational Employment and Wage Statistics surveys. 2026–2026 figures are current estimates, and 2027 values are projections, calculated using a 2.52% CAGR derived from 7-year BLS historical data. Actual salaries may vary based on employer, experience, certifications, and local market conditions.
Salary by Experience Level
| Experience | Estimated Salary Range |
|---|---|
| 0-2 years (New Graduate) | $39,844 – $44,395 |
| 3-5 years (Mid Career) | $44,395 – $56,797 |
| 5+ years (Experienced) | $56,797 – $72,700 |
| 10+ years (Top Earner) | $72,700 – $88,036 |
Plumber salary ranges estimated from BLS percentile data. Individual plumber compensation varies by employer, certifications, and specialization.
Plumber Job Market in Martinsburg
In a market characterized by a small but stable workforce—only six plumbers currently employed—understanding the cost of living is crucial for prospective plumbers in Martinsburg. With a cost-of-living index of 86.5, individuals may find their take-home pay stretches further than in other regions. Notably, union plumbing contractors often offer the best pay, while non-union and self-employed plumbers face more variability. The pay gap can also be influenced by specialty skills, such as medical gas qualifications or licensing for backflow prevention, which command higher rates. For those looking to maximize their plumber pay in Martinsburg, gaining additional certifications, seeking union affiliation, and considering roles with large service companies could significantly impact earnings in this competitive market. The ongoing demand driven by aging infrastructure further solidifies job security and potential salary growth in this sector.
More salary data for Martinsburg, WV:
Frequently Asked Questions
How much do plumbers make in Martinsburg, WV in 2026?
Is Martinsburg, WV a good place to work as a plumber?
Can plumbers make $100K in Martinsburg?
What is the cost-of-living adjusted plumber salary in Martinsburg?
How much does a plumber make per hour in Martinsburg?
Related Pages
Compare Salaries
Career Resources
Nearby Cities in West Virginia
Written by Samuel Torres, CWP
Career Analyst
Samuel Torres has 10 years of experience in plumbing. He specializes in residential plumbing systems. He has worked with several home improvement companies.
Methodology & Data Source
Salary figures on this page are 2026 projections based on the Bureau of Labor Statistics Occupational Employment and Wage Statistics (OEWS) survey, May 2026 release. The BLS reported a median annual salary of $55,401 for plumbersin the Martinsburg metropolitan area. A 2.52% compound annual growth rate (CAGR), calculated from 6-year national BLS wage trends, was applied to project current 2026 compensation. Percentile ranges (P10–P90) represent the full salary distribution across experience levels and practice settings in this market.
Data Sources & Methodology
Salary data for Martinsburg is estimated from official BLS state-level occupational wage data (2025), adjusted for regional cost-of-living differences using BEA RPP (Regional Price Parities).
2026 figures are projected from 2025 BLS data using a compound annual growth rate (CAGR) of 2.52%, derived from historical BLS wage trends for plumbers (SOC 47-2152).
Compiled and verified by Samuel Torres, CWP, a licensed plumber with 10+ years of clinical experience. · View source data at BLS.gov