Plumber Salary in Rapid City, SD: $57,257 (2026)
Quick Answer:A full-time plumber in Rapid City, SD earns a median $57,257/year (≈ $27.53/hour) in nominal terms for 2026 — projected from BLS OEWS 2025 (SOC 47-2152). Once you factor in Rapid City's price level (11% below national, BEA RPP 89.2), that paycheck buys what $64,218 would nationally. Nominal pay sits 5.7% below the South Dakota state average.
Official BLS data · View source
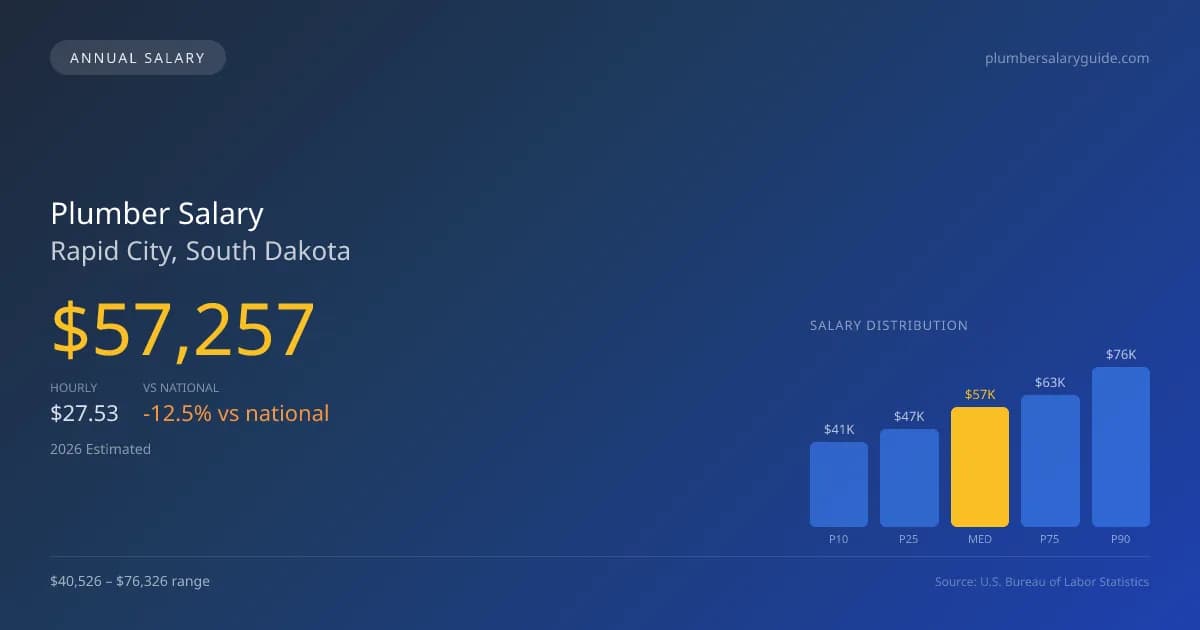
In Rapid City, South Dakota, plumbers earn a median salary of $57,257 in 2026, which is notably lower than the national median of $65,408. The salary range for plumbers in this region stretches from $40,526 at the 10th percentile to $76,326 at the 90th percentile, reflecting a diverse market that can be influenced by factors such as experience, specialization, and whether one is part of a union. The data originates from 2025 BLS OEWS surveys, with projections indicating a robust growth trend of 2.52% over the next five years. In this local market, a pronounced pay gap exists between union pipefitters, affiliated with the UA (United Association), and non-union service plumbers, who generally command lower wages.
Salary Breakdown
| Percentile | Annual | Hourly |
|---|---|---|
| Entry Level (P10) | $40,526 | $19.49 |
| Lower Range (P25) | $46,524 | $22.37 |
| Median (P50)(typical) | $57,257 | $27.53 |
| Upper Range (P75) | $62,845 | $30.21 |
| Top Earners (P90) | $76,326 | $36.69 |
Median Salary Position
12.46% below the national average
2026 Salary Percentile Distribution in Rapid City
In Rapid City, SD, the plumber salary spread from the 10th to 90th percentile is $35,800 (2026 est.). At $57,257, the local median is 12.46% below the national median of $65,408.
Salary Calculator
At 40 hours/week in Rapid City: You'd be in the lower-middle range
How Rapid City Plumber Pay Compares
Rapid City median: $57,257/year (2026)
| Compared To | Median Salary | Rapid City Pays |
|---|---|---|
| South Dakota Average | $60,718 | -5.70% less |
| National Average | $65,408 | -12.46% less |
Plumbers in Rapid City, SD earn a median of $57,257 per year (2026 est.), which is 12.46% lower than the national median of $65,408 and 5.70% below the South Dakota state average of $60,718.
Cost-of-Living Adjusted Salary
Rapid City has a cost of living 10.84% below the national average, meaning your salary goes further here.
Adjusted salary = nominal × (100 / CoL index). CoL index: 100 = national average.
Rapid City, SD has a cost-of-living index of 89.16 (below the national average of 100). A plumber earning $57,257 nominally has purchasing power equivalent to $64,218 in an average-cost city — an effective 12.16% boost.
Compare Purchasing Power
Select a city to see how your salary compares after cost of living
Select a city above to compare purchasing power
2019 BLS Actual
$43,130
2025 BLS Actual
$55,850
2026 Current Est.
$57,257
2019–2027 Growth
+36.1%
Salary Trajectory for Plumbers in Rapid City (2019–2027)
2019–2025: actual BLS OEWS data for this metro area. 2026+: CAGR 2.52% projection.
| Year | Annual Salary | Status |
|---|---|---|
| 2019 | $43,130 | Actual |
| 2020 | $44,490 | Actual |
| 2021 | $47,060 | Actual |
| 2022 | $49,620 | Actual |
| 2023 | $53,700 | Actual |
| 2024 | $52,600 | Actual |
| 2025 | $55,850 | Actual |
| 2026(current) | $57,257 | Estimated |
| 2027 | $58,700 | Projected |
Based on 7 years of BLS OEWS data for the Rapid City metropolitan area, the median plumber salary grew 29.5% from $43,130 (2019) to $55,850 (2025). At a 2.52% compound annual growth rate, salaries are projected to reach $58,700 by 2027 — a total increase of $15,570 (36.10%) from 2019.
Note: Historical values (2019–2025) are actual BLS OEWS figures for the Rapid City metropolitan area, sourced from annual Occupational Employment and Wage Statistics surveys. 2026–2026 figures are current estimates, and 2027 values are projections, calculated using a 2.52% CAGR derived from 7-year BLS historical data. Actual salaries may vary based on employer, experience, certifications, and local market conditions.
Salary by Experience Level
| Experience | Estimated Salary Range |
|---|---|
| 0-2 years (New Graduate) | $40,526 – $46,524 |
| 3-5 years (Mid Career) | $46,524 – $57,257 |
| 5+ years (Experienced) | $57,257 – $62,845 |
| 10+ years (Top Earner) | $62,845 – $76,326 |
Plumber salary ranges estimated from BLS percentile data. Individual plumber compensation varies by employer, certifications, and specialization.
Plumber Job Market in Rapid City
The job market for plumbers in Rapid City is supported by approximately 360 employed in the field, fostering competitive conditions despite an average cost of living index of 89.16, indicating that living expenses are below the national average. This lower cost of living enhances take-home purchasing power, benefiting those in the residential and light commercial plumbing sectors, as well as industrial maintenance teams. Among the highest-paying employers are UA union contractors, whose pipefitting wages often exceed those of their non-union counterparts. The pay spectrum is influenced by various factors, including specialized credentials such as medical gas certifications, the ability to obtain a master plumber or contractor license, and commission structures at large service companies like Roto-Rooter. For those aiming to maximize their earnings in Rapid City, pursuing union membership, seeking out specialty work, and considering self-employment could be pivotal strategies for improving plumber pay in Rapid City SD.
More salary data for Rapid City, SD:
Frequently Asked Questions
How much do plumbers make in Rapid City, SD in 2026?
Is Rapid City, SD a good place to work as a plumber?
Can plumbers make $100K in Rapid City?
What is the cost-of-living adjusted plumber salary in Rapid City?
How much does a plumber make per hour in Rapid City?
Related Pages
Compare Salaries
Career Resources
Nearby Cities in South Dakota
Written by Samuel Torres, CWP
Career Analyst
Samuel Torres has 10 years of experience in plumbing. He specializes in residential plumbing systems. He has worked with several home improvement companies.
Methodology & Data Source
Salary figures on this page are 2026 projections based on the Bureau of Labor Statistics Occupational Employment and Wage Statistics (OEWS) survey, May 2026 release. The BLS reported a median annual salary of $55,850 for plumbersin the Rapid City metropolitan area. A 2.52% compound annual growth rate (CAGR), calculated from 6-year national BLS wage trends, was applied to project current 2026 compensation. Percentile ranges (P10–P90) represent the full salary distribution across experience levels and practice settings in this market.
Data Sources & Methodology
Source: BLS, OEWS, 7-year dataset (–). Per-city data from annual BLS metropolitan area surveys.
2026 figures are projected from 2025 BLS data using a compound annual growth rate (CAGR) of 2.52%, derived from historical BLS wage trends for plumbers (SOC 47-2152).
Compiled and verified by Samuel Torres, CWP, a licensed plumber with 10+ years of clinical experience. · View source data at BLS.gov