Plumber Salary in North Carolina: $58,902 (2026)
Quick Answer:Across North Carolina's 45 metropolitan areas, the average median plumber pay sits at $58,902/year heading into 2026 — a figure projected from 2025 BLS OEWS wage data for SOC 47-2152. Because North Carolina sits at BEA RPP 93.6 (6% below the U.S. baseline), that statewide median translates to roughly $62,929 in nationally-comparable purchasing power. Highest-paying metros: Chapel Hill ($60,613), Raleigh ($60,540), Cary ($60,252).
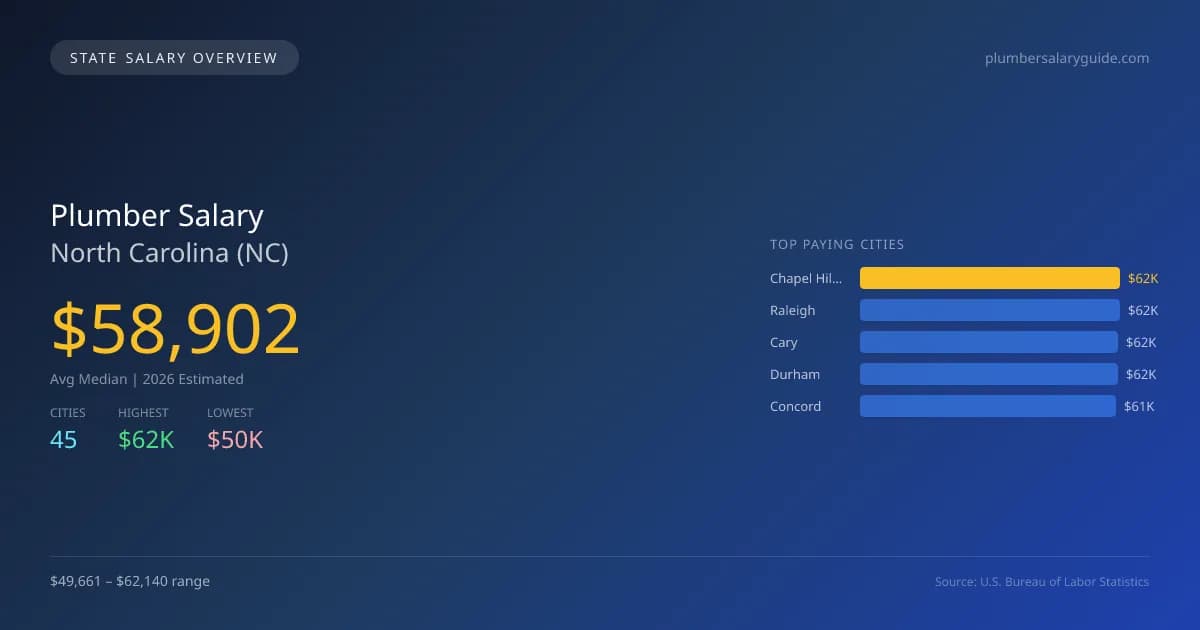
In 2026, the average median salary for plumbers in North Carolina is projected to be $58,903, which is approximately 9.9% lower than the national median of $65,408. The highest paying city for plumbers in the state is Chapel Hill at $62,140, while Pinehurst offers the lowest salary at $49,661, creating a gap of $12,479. This salary variation can be attributed to factors like the cost of living, local demand for plumbing services, and the concentration of residential and commercial developments in urban areas compared to rural settings. North Carolina requires plumbers to hold licenses, which entails passing examinations and meeting specific state regulations. As the scope of practice laws evolve, licensed plumbers may find increased responsibility and demand for their services, especially in growing metropolitan areas. The total employment of plumbers stands at 12,674, with projected strong growth at an annual rate of 2.52%. Metropolitan areas such as Raleigh ($62,066), Cary ($61,770), Durham ($61,625), and Concord ($61,153) show a strong demand for skilled plumbers, indicating a positive job market outlook for those entering the field in North Carolina.
North Carolina Plumber Salary Range
Overall salary range in North Carolina: $37,379 (lowest entry-level) to $96,318 (highest top earner)
North Carolina vs National Average
North Carolina plumbers earn 9.95% less than the national median ($-6,506/year difference).
North Carolina Plumber Salary Distribution (2026)
Plumber salaries in North Carolina range from $42,004 (entry-level, 10th percentile) to $77,642 (top earners, 90th percentile), with a median of $58,902. The North Carolina median is $6,506 below the US national median of $65,408. The average hourly rate is $28.32/hr. Approximately 12,674 plumbers are employed across 45 cities.
2019 BLS Actual
$45,150
2025 BLS Actual
$57,455
2026 Current Est.
$58,902
2019–2027 Growth
+33.7%
Salary Trajectory for Plumbers in North Carolina (2019–2027)
2019–2025: actual BLS OEWS data for this metro area. 2026+: CAGR 2.52% projection.
| Year | Annual Salary | Status |
|---|---|---|
| 2019 | $45,150 | Actual |
| 2020 | $45,423 | Actual |
| 2021 | $47,749 | Actual |
| 2022 | $48,159 | Actual |
| 2023 | $53,166 | Actual |
| 2024 | $54,006 | Actual |
| 2025 | $57,455 | Actual |
| 2026(current) | $58,902 | Estimated |
| 2027 | $60,387 | Projected |
Based on 7 years of BLS OEWS data for the North Carolina metropolitan area, the median plumber salary grew 27.3% from $45,150 (2019) to $57,455 (2025). At a 2.52% compound annual growth rate, salaries are projected to reach $60,387 by 2027 — a total increase of $15,237 (33.75%) from 2019.
Note: Historical values (2019–2025) are actual BLS OEWS figures for the North Carolina metropolitan area, sourced from annual Occupational Employment and Wage Statistics surveys. 2026–2026 figures are current estimates, and 2027 values are projections, calculated using a 2.52% CAGR derived from 7-year BLS historical data. Actual salaries may vary based on employer, experience, certifications, and local market conditions.
Top 5 Highest Paying Cities in North Carolina
Lowest Paying Cities in North Carolina
| City | Median Salary |
|---|---|
| Pinehurst | $49,661 |
| Winston | $50,481 |
| Goldsboro | $52,552 |
| Hickory | $52,624 |
| Fayetteville | $53,044 |
Best Value Cities for Plumbers in North Carolina
When adjusted for local cost of living, these North Carolina cities offer the most purchasing power for plumbers.
| City | Nominal Salary | CoL Index | Adjusted Salary |
|---|---|---|---|
| Chapel Hill | $62,140 | 93.6 | $66,389 |
| Greenville | $58,518 | 88.402 | $66,195 |
| Cary | $61,770 | 93.6 | $65,994 |
| Rocky Mount | $57,637 | 88.012 | $65,488 |
| Concord | $61,153 | 93.6 | $65,334 |
Adjusted salary = nominal salary × (100 / CoL index). CoL index: 100 = national average. Lower index = lower cost of living.
Salary by Experience Level in North Carolina
| Experience Level | Estimated Annual |
|---|---|
| Entry Level (0-2 years) | $42,004 |
| Mid Career (3-7 years) | $58,902 |
| Experienced (7+ years) | $77,642 |
Estimates based on BLS percentile data averaged across North Carolina metro areas. Individual pay varies by employer, certifications, and specialization.
All 45 Cities in North Carolina
| # | City | Median Salary |
|---|---|---|
| 1 | Chapel Hill | $62,140 |
| 2 | Raleigh | $62,066 |
| 3 | Cary | $61,770 |
| 4 | Durham | $61,625 |
| 5 | Concord | $61,153 |
| 6 | Asheville | $60,692 |
| 7 | Charlotte | $60,169 |
| 8 | Winston-Salem | $59,915 |
| 9 | Greensboro | $58,959 |
| 10 | Gastonia | $58,886 |
| 11 | Greenville | $58,518 |
| 12 | Huntersville | $58,430 |
| 13 | Kannapolis | $58,339 |
| 14 | Burlington | $58,324 |
| 15 | Apex | $58,202 |
| 16 | High Point | $58,051 |
| 17 | Wilmington | $57,811 |
| 18 | Rocky Mount | $57,637 |
| 19 | Statesville | $57,330 |
| 20 | Kernersville | $57,281 |
| 21 | Matthews | $57,147 |
| 22 | Cornelius | $57,048 |
| 23 | Sanford | $56,999 |
| 24 | Wake Forest | $56,997 |
| 25 | Morrisville | $56,971 |
| 26 | Fuquay-Varina | $56,820 |
| 27 | Salisbury | $56,810 |
| 28 | Thomasville | $56,716 |
| 29 | New Bern | $56,694 |
| 30 | Mint Hill | $56,680 |
| 31 | Holly Springs | $55,783 |
| 32 | Mooresville | $55,608 |
| 33 | Monroe | $55,585 |
| 34 | Garner | $55,460 |
| 35 | Wilson | $55,419 |
| 36 | Boone | $55,179 |
| 37 | Indian Trail | $54,702 |
| 38 | Jacksonville | $54,571 |
| 39 | Carrboro | $54,488 |
| 40 | Leland | $53,684 |
| 41 | Fayetteville | $53,044 |
| 42 | Hickory | $52,624 |
| 43 | Goldsboro | $52,552 |
| 44 | Winston | $50,481 |
| 45 | Pinehurst | $49,661 |
More North Carolina Salary Data
Compare Cities in North Carolina
View all comparisons →Explore More Plumber Salary Data
Frequently Asked Questions
How much do plumbers make in North Carolina in 2026?
What is the highest paying city for plumbers in North Carolina?
How does North Carolina plumber pay compare to the national average?
What is the entry-level plumber salary in North Carolina?
How many plumbers are employed in North Carolina?
Which North Carolina city offers the best value for plumbers?
Written by Samuel Torres, CWP
Career Analyst
Samuel Torres has 10 years of experience in plumbing. He specializes in residential plumbing systems. He has worked with several home improvement companies.
Methodology & Data Source
Statewide salary figures on this page are 2026 projections based on the Bureau of Labor Statistics Occupational Employment and Wage Statistics (OEWS) survey, May 2026 release. A 2.52% compound annual growth rate (CAGR), derived from 6-year national BLS wage trends, was applied to each metro area's reported salary to estimate current 2026 plumber compensation across North Carolina. State averages are employment-weighted across 45 metro areas — larger metro areas with more plumberscontribute proportionally more to the average, producing figures that better reflect typical compensation. Individual pay varies by city, employer, certifications, and experience.
Data Sources & Methodology
Source: BLS, OEWS, 7-year dataset (–). Per-city data from annual BLS metropolitan area surveys.
2026 figures are projected from 2025 BLS data using a compound annual growth rate (CAGR) of 2.52%, derived from historical BLS wage trends for plumbers (SOC 47-2152).
Compiled and verified by Samuel Torres, CWP, a licensed plumber with 10+ years of clinical experience. · View source data at BLS.gov