Plumber Salary in Union City, NJ: $74,314 (2026)
Quick Answer:A full-time plumber in Union City, NJ earns a median $74,314/year (≈ $35.73/hour) in nominal terms for 2026 — projected from BLS OEWS 2025 (SOC 47-2152). Once you factor in Union City's price level (15% above national, BEA RPP 115.2), that paycheck buys what $64,509 would nationally. Nominal pay sits 1.4% below the New Jersey state average.
Based on BLS state-level estimates · View source
In Union City, NJ, the plumbing profession offers a competitive wage structure, highlighted by a median annual salary of $74,314 in 2026, which stands 13.62% above the national median for plumbers. This solid salary range runs from $54,218 at the 10th percentile to $115,186 at the 90th percentile. While these figures are influenced by local cost-of-living adjustments, it's evident that union pipefitters, particularly those belonging to the United Association (UA), dominate the market, often enjoying salaries that can exceed their non-union counterparts by 30-50%. As job opportunities remain steady, the distinction between union and non-union pay in Union City greatly impacts overall earning potential, especially for those who hold specialized credentials in areas such as medical gas installation.
About the Union City Market
Salary estimated from New Jersey average ($82,000) adjusted for local cost of living.
Salary Breakdown
| Percentile | Annual | Hourly |
|---|---|---|
| Entry Level (P10) | $54,218 | $26.07 |
| Lower Range (P25) | $59,998 | $28.85 |
| Median (P50)(typical) | $74,314 | $35.73 |
| Upper Range (P75) | $95,121 | $45.73 |
| Top Earners (P90) | $115,186 | $55.38 |
Median Salary Position
13.62% above the national average
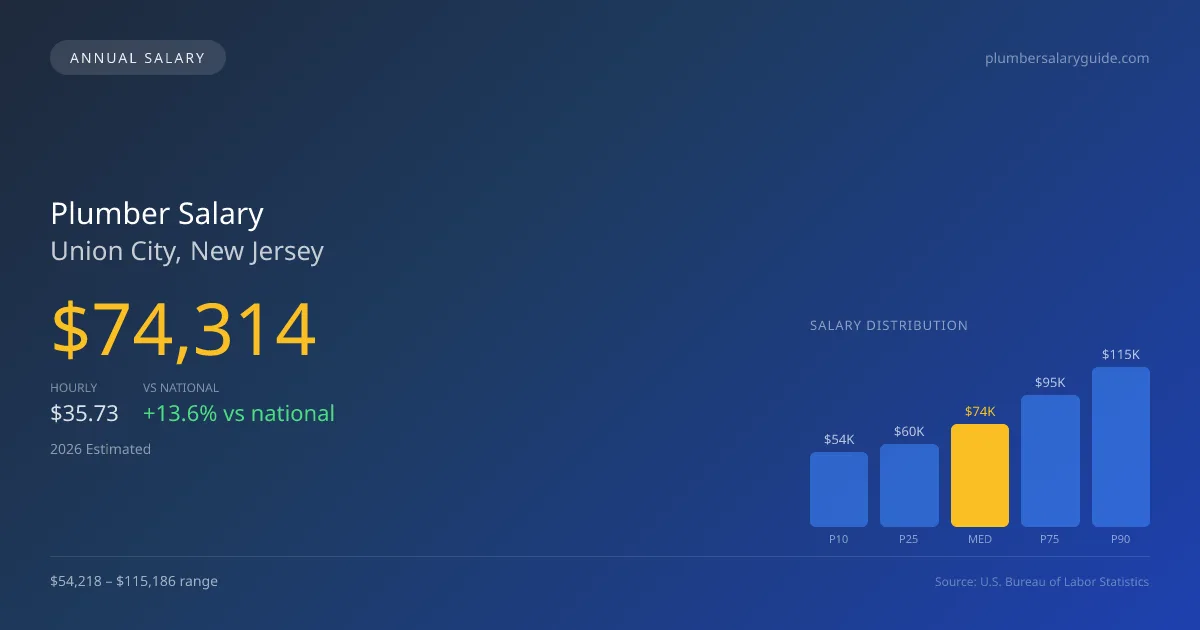
2026 Salary Percentile Distribution in Union City
In Union City, NJ, the plumber salary spread from the 10th to 90th percentile is $60,968 (2026 est.). At $74,314, the local median is 13.62% above the national median of $65,408.
Salary Calculator
At 40 hours/week in Union City: You'd be in the lower-middle range
How Union City Plumber Pay Compares
Union City median: $74,314/year (2026)
| Compared To | Median Salary | Union City Pays |
|---|---|---|
| New Jersey Average | $75,369 | -1.40% less |
| National Average | $65,408 | +13.62% more |
Plumbers in Union City, NJ earn a median of $74,314 per year (2026 est.), which is 13.62% higher than the national median of $65,408 and 1.40% below the New Jersey state average of $75,369.
Cost-of-Living Adjusted Salary
Union City has a cost of living 15.20% above the national average.
Adjusted salary = nominal × (100 / CoL index). CoL index: 100 = national average.
Union City, NJ has a cost-of-living index of 115.2 (above the national average of 100). While the nominal salary of $74,314 is competitive, the higher cost of living reduces purchasing power to an effective $64,509 — a 13.19% reduction.
Compare Purchasing Power
Select a city to see how your salary compares after cost of living
Select a city above to compare purchasing power
2019 BLS Actual
$62,671
2025 BLS Actual
$72,487
2026 Current Est.
$74,314
2019–2027 Growth
+21.6%
Salary Trajectory for Plumbers in Union City (2019–2027)
2019–2025: actual BLS OEWS data for this metro area. 2026+: CAGR 2.52% projection.
| Year | Annual Salary | Status |
|---|---|---|
| 2019 | $62,671 | Actual |
| 2020 | $64,000 | Actual |
| 2021 | $68,033 | Actual |
| 2022 | $68,272 | Actual |
| 2023 | $69,931 | Actual |
| 2024 | $93,164 | Actual |
| 2025 | $72,487 | Actual |
| 2026(current) | $74,314 | Estimated |
| 2027 | $76,186 | Projected |
Based on 7 years of BLS OEWS data for the Union City metropolitan area, the median plumber salary grew 15.7% from $62,671 (2019) to $72,487 (2025). At a 2.52% compound annual growth rate, salaries are projected to reach $76,186 by 2027 — a total increase of $13,515 (21.56%) from 2019.
Note: Historical values (2019–2025) are actual BLS OEWS figures for the Union City metropolitan area, sourced from annual Occupational Employment and Wage Statistics surveys. 2026–2026 figures are current estimates, and 2027 values are projections, calculated using a 2.52% CAGR derived from 7-year BLS historical data. Actual salaries may vary based on employer, experience, certifications, and local market conditions.
Salary by Experience Level
| Experience | Estimated Salary Range |
|---|---|
| 0-2 years (New Graduate) | $54,218 – $59,998 |
| 3-5 years (Mid Career) | $59,998 – $74,314 |
| 5+ years (Experienced) | $74,314 – $95,121 |
| 10+ years (Top Earner) | $95,121 – $115,186 |
Plumber salary ranges estimated from BLS percentile data. Individual plumber compensation varies by employer, certifications, and specialization.
Plumber Job Market in Union City
The job market for plumbers in Union City is supported by a workforce of around 17 employed plumbers, yet high living costs, reflected by a cost-of-living index of 115.2, can strain take-home pay. Employers that typically offer higher compensation are union plumbing contractors and larger service companies like Roto-Rooter and ARS/Rescue Rooter, which feature commission-based pay structures. Additionally, industrial maintenance teams in manufacturing settings often provide robust pay, particularly for plumbers who have acquired advanced specialty skills, such as medical gas certification or backflow prevention. To maximize earnings in this region, plumbers should consider obtaining advanced licenses and specialized training while also exploring opportunities in unionized settings, where longer-term job stability and superior benefits are often available compared to non-union service roles.
More salary data for Union City, NJ:
Frequently Asked Questions
How much do plumbers make in Union City, NJ in 2026?
Is Union City, NJ a good place to work as a plumber?
Can plumbers make $100K in Union City?
What is the cost-of-living adjusted plumber salary in Union City?
How much does a plumber make per hour in Union City?
Related Pages
Compare Salaries
Career Resources
Nearby Cities in New Jersey
Written by Samuel Torres, CWP
Career Analyst
Samuel Torres has 10 years of experience in plumbing. He specializes in residential plumbing systems. He has worked with several home improvement companies.
Methodology & Data Source
Salary figures on this page are 2026 projections based on the Bureau of Labor Statistics Occupational Employment and Wage Statistics (OEWS) survey, May 2026 release. The BLS reported a median annual salary of $72,487 for plumbersin the Union City metropolitan area. A 2.52% compound annual growth rate (CAGR), calculated from 6-year national BLS wage trends, was applied to project current 2026 compensation. Percentile ranges (P10–P90) represent the full salary distribution across experience levels and practice settings in this market.
Data Sources & Methodology
Salary data for Union City is estimated from official BLS state-level occupational wage data (2025), adjusted for regional cost-of-living differences using BEA RPP (Regional Price Parities).
2026 figures are projected from 2025 BLS data using a compound annual growth rate (CAGR) of 2.52%, derived from historical BLS wage trends for plumbers (SOC 47-2152).
Compiled and verified by Samuel Torres, CWP, a licensed plumber with 10+ years of clinical experience. · View source data at BLS.gov