Plumber Salary in Piscataway, NJ: $74,928 (2026)
Quick Answer:A full-time plumber in Piscataway, NJ earns a median $74,928/year (≈ $36.03/hour) in nominal terms for 2026 — projected from BLS OEWS 2025 (SOC 47-2152). Once you factor in Piscataway's price level (15% above national, BEA RPP 115.2), that paycheck buys what $65,042 would nationally. Nominal pay sits 0.6% below the New Jersey state average.
Based on BLS state-level estimates · View source
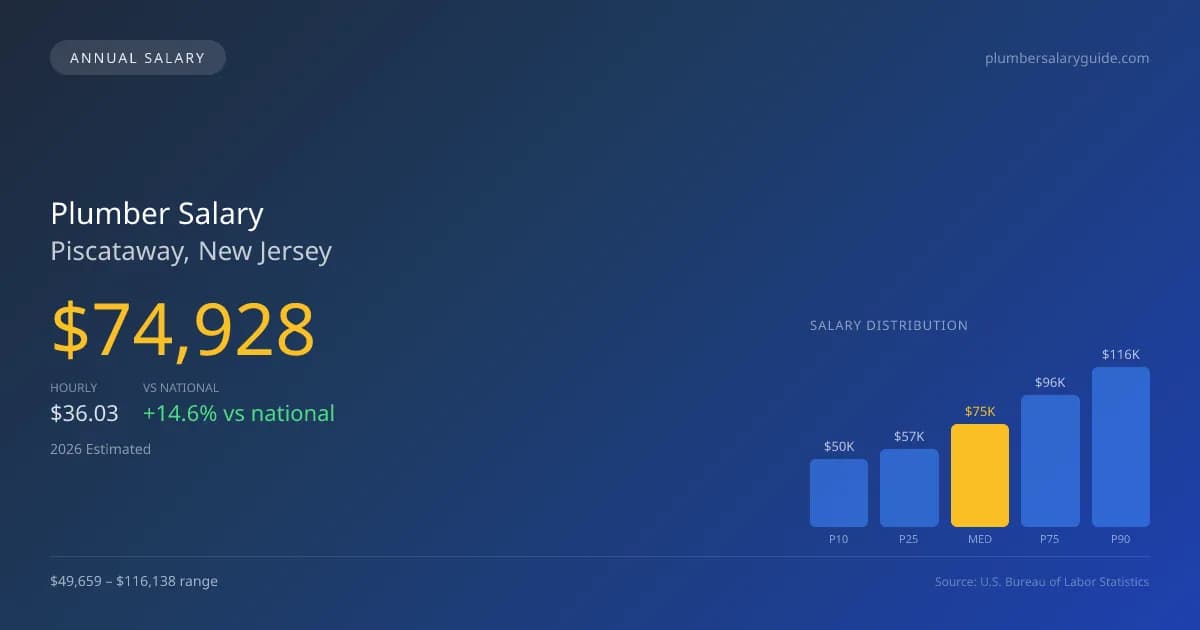
In Piscataway, NJ, the projected plumber salary in 2026 reaches a median of $74,928, notably surpassing the national median of $65,408 by 14.55%. This difference illustrates the effect of local market dynamics, particularly the disparity between union pipefitters and non-union service plumbers, with the former often commanding a significant pay premium. The salary range for plumbers in the area varies widely, from $49,659 at the 10th percentile to as much as $116,138 at the 90th percentile. These figures are derived from estimates based on 2025 BLS data and regional price adjustments, reflecting both the industry's demand and the influence of the cost of living in Piscataway.
About the Piscataway Market
Salary estimated from New Jersey average ($82,000) adjusted for local cost of living.
Salary Breakdown
| Percentile | Annual | Hourly |
|---|---|---|
| Entry Level (P10) | $49,659 | $23.88 |
| Lower Range (P25) | $56,740 | $27.28 |
| Median (P50)(typical) | $74,928 | $36.03 |
| Upper Range (P75) | $95,907 | $46.11 |
| Top Earners (P90) | $116,138 | $55.83 |
Median Salary Position
14.55% above the national average
2026 Salary Percentile Distribution in Piscataway
In Piscataway, NJ, the plumber salary spread from the 10th to 90th percentile is $66,479 (2026 est.). At $74,928, the local median is 14.55% above the national median of $65,408.
Salary Calculator
At 40 hours/week in Piscataway: You'd be in the lower-middle range
How Piscataway Plumber Pay Compares
Piscataway median: $74,928/year (2026)
| Compared To | Median Salary | Piscataway Pays |
|---|---|---|
| New Jersey Average | $75,380 | -0.60% less |
| National Average | $65,408 | +14.55% more |
Plumbers in Piscataway, NJ earn a median of $74,928 per year (2026 est.), which is 14.55% higher than the national median of $65,408 and 0.60% below the New Jersey state average of $75,380.
Cost-of-Living Adjusted Salary
Piscataway has a cost of living 15.20% above the national average.
Adjusted salary = nominal × (100 / CoL index). CoL index: 100 = national average.
Piscataway, NJ has a cost-of-living index of 115.2 (above the national average of 100). While the nominal salary of $74,928 is competitive, the higher cost of living reduces purchasing power to an effective $65,042 — a 13.19% reduction.
Compare Purchasing Power
Select a city to see how your salary compares after cost of living
Select a city above to compare purchasing power
2019 BLS Actual
$63,188
2025 BLS Actual
$73,086
2026 Current Est.
$74,928
2019–2027 Growth
+21.6%
Salary Trajectory for Plumbers in Piscataway (2019–2027)
2019–2025: actual BLS OEWS data for this metro area. 2026+: CAGR 2.52% projection.
| Year | Annual Salary | Status |
|---|---|---|
| 2019 | $63,188 | Actual |
| 2020 | $64,529 | Actual |
| 2021 | $68,595 | Actual |
| 2022 | $68,836 | Actual |
| 2023 | $70,509 | Actual |
| 2024 | $93,935 | Actual |
| 2025 | $73,086 | Actual |
| 2026(current) | $74,928 | Estimated |
| 2027 | $76,816 | Projected |
Based on 7 years of BLS OEWS data for the Piscataway metropolitan area, the median plumber salary grew 15.7% from $63,188 (2019) to $73,086 (2025). At a 2.52% compound annual growth rate, salaries are projected to reach $76,816 by 2027 — a total increase of $13,628 (21.57%) from 2019.
Note: Historical values (2019–2025) are actual BLS OEWS figures for the Piscataway metropolitan area, sourced from annual Occupational Employment and Wage Statistics surveys. 2026–2026 figures are current estimates, and 2027 values are projections, calculated using a 2.52% CAGR derived from 7-year BLS historical data. Actual salaries may vary based on employer, experience, certifications, and local market conditions.
Salary by Experience Level
| Experience | Estimated Salary Range |
|---|---|
| 0-2 years (New Graduate) | $49,659 – $56,740 |
| 3-5 years (Mid Career) | $56,740 – $74,928 |
| 5+ years (Experienced) | $74,928 – $95,907 |
| 10+ years (Top Earner) | $95,907 – $116,138 |
Plumber salary ranges estimated from BLS percentile data. Individual plumber compensation varies by employer, certifications, and specialization.
Plumber Job Market in Piscataway
Despite the presence of only 14 plumbers employed locally, the labor market showcases a diverse array of compensation structures. The cost of living index in Piscataway stands at 115.2, indicating higher expenses which can impact the take-home pay significantly. Union contractors, particularly those affiliated with the UA, typically offer the highest compensation, due to established wage frameworks. In addition to this, industries focusing on specialties like medical gas or industrial pipefitting tend to provide elevated salaries. Various factors drive the compensation gap, including credentials such as master and contractor licenses, overtime pay, and commission structures in service-oriented roles. For those looking to maximize their plumber pay in Piscataway, pursuing union affiliation, high-demand specialties, and continuing education can prove beneficial.
More salary data for Piscataway, NJ:
Frequently Asked Questions
How much do plumbers make in Piscataway, NJ in 2026?
Is Piscataway, NJ a good place to work as a plumber?
Can plumbers make $100K in Piscataway?
What is the cost-of-living adjusted plumber salary in Piscataway?
How much does a plumber make per hour in Piscataway?
Related Pages
Compare Salaries
Career Resources
Nearby Cities in New Jersey
Written by Samuel Torres, CWP
Career Analyst
Samuel Torres has 10 years of experience in plumbing. He specializes in residential plumbing systems. He has worked with several home improvement companies.
Methodology & Data Source
Salary figures on this page are 2026 projections based on the Bureau of Labor Statistics Occupational Employment and Wage Statistics (OEWS) survey, May 2026 release. The BLS reported a median annual salary of $73,086 for plumbersin the Piscataway metropolitan area. A 2.52% compound annual growth rate (CAGR), calculated from 6-year national BLS wage trends, was applied to project current 2026 compensation. Percentile ranges (P10–P90) represent the full salary distribution across experience levels and practice settings in this market.
Data Sources & Methodology
Salary data for Piscataway is estimated from official BLS state-level occupational wage data (2025), adjusted for regional cost-of-living differences using BEA RPP (Regional Price Parities).
2026 figures are projected from 2025 BLS data using a compound annual growth rate (CAGR) of 2.52%, derived from historical BLS wage trends for plumbers (SOC 47-2152).
Compiled and verified by Samuel Torres, CWP, a licensed plumber with 10+ years of clinical experience. · View source data at BLS.gov