Plumber Salary in Hackensack, NJ: $72,303 (2026)
Quick Answer:A full-time plumber in Hackensack, NJ earns a median $72,303/year (≈ $34.76/hour) in nominal terms for 2026 — projected from BLS OEWS 2025 (SOC 47-2152). Once you factor in Hackensack's price level (15% above national, BEA RPP 115.2), that paycheck buys what $62,763 would nationally. Nominal pay sits 4.0% below the New Jersey state average.
Based on BLS state-level estimates · View source
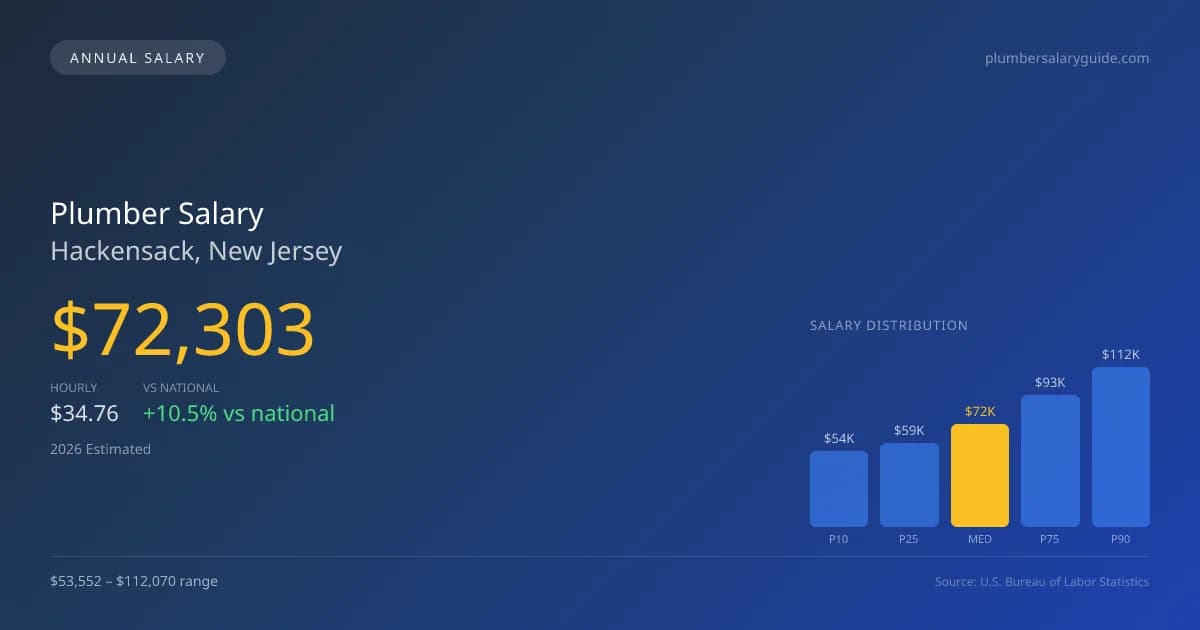
In Hackensack, NJ, the anticipated plumber salary in 2026 is projected at $72,303 annually, representing a noteworthy 10.54% increase compared to the national median of $65,408. The salary spectrum ranges from $53,552 at the 10th percentile to $112,070 at the 90th percentile, illustrating the variations based on skills, specialties, and levels of experience. These figures are derived from a combination of BLS state-level data and adjustments for regional price differences. With the growing demand for various plumbing specialties, including medical gas and industrial pipelines, Hackensack offers competitive compensation opportunities, making it an attractive market for both employed plumbers and those venturing into self-employment or specialized fields.
About the Hackensack Market
Salary estimated from New Jersey average ($82,000) adjusted for local cost of living.
Salary Breakdown
| Percentile | Annual | Hourly |
|---|---|---|
| Entry Level (P10) | $53,552 | $25.74 |
| Lower Range (P25) | $58,658 | $28.20 |
| Median (P50)(typical) | $72,303 | $34.76 |
| Upper Range (P75) | $92,548 | $44.49 |
| Top Earners (P90) | $112,070 | $53.88 |
Median Salary Position
10.54% above the national average
2026 Salary Percentile Distribution in Hackensack
In Hackensack, NJ, the plumber salary spread from the 10th to 90th percentile is $58,518 (2026 est.). At $72,303, the local median is 10.54% above the national median of $65,408.
Salary Calculator
At 40 hours/week in Hackensack: You'd be in the lower-middle range
How Hackensack Plumber Pay Compares
Hackensack median: $72,303/year (2026)
| Compared To | Median Salary | Hackensack Pays |
|---|---|---|
| New Jersey Average | $75,316 | -4.00% less |
| National Average | $65,408 | +10.54% more |
Plumbers in Hackensack, NJ earn a median of $72,303 per year (2026 est.), which is 10.54% higher than the national median of $65,408 and 4.00% below the New Jersey state average of $75,316.
Cost-of-Living Adjusted Salary
Hackensack has a cost of living 15.20% above the national average.
Adjusted salary = nominal × (100 / CoL index). CoL index: 100 = national average.
Hackensack, NJ has a cost-of-living index of 115.2 (above the national average of 100). While the nominal salary of $72,303 is competitive, the higher cost of living reduces purchasing power to an effective $62,763 — a 13.19% reduction.
Compare Purchasing Power
Select a city to see how your salary compares after cost of living
Select a city above to compare purchasing power
2019 BLS Actual
$60,975
2025 BLS Actual
$70,526
2026 Current Est.
$72,303
2019–2027 Growth
+21.6%
Salary Trajectory for Plumbers in Hackensack (2019–2027)
2019–2025: actual BLS OEWS data for this metro area. 2026+: CAGR 2.52% projection.
| Year | Annual Salary | Status |
|---|---|---|
| 2019 | $60,975 | Actual |
| 2020 | $62,268 | Actual |
| 2021 | $66,193 | Actual |
| 2022 | $66,425 | Actual |
| 2023 | $68,039 | Actual |
| 2024 | $90,644 | Actual |
| 2025 | $70,526 | Actual |
| 2026(current) | $72,303 | Estimated |
| 2027 | $74,125 | Projected |
Based on 7 years of BLS OEWS data for the Hackensack metropolitan area, the median plumber salary grew 15.7% from $60,975 (2019) to $70,526 (2025). At a 2.52% compound annual growth rate, salaries are projected to reach $74,125 by 2027 — a total increase of $13,150 (21.57%) from 2019.
Note: Historical values (2019–2025) are actual BLS OEWS figures for the Hackensack metropolitan area, sourced from annual Occupational Employment and Wage Statistics surveys. 2026–2026 figures are current estimates, and 2027 values are projections, calculated using a 2.52% CAGR derived from 7-year BLS historical data. Actual salaries may vary based on employer, experience, certifications, and local market conditions.
Salary by Experience Level
| Experience | Estimated Salary Range |
|---|---|
| 0-2 years (New Graduate) | $53,552 – $58,658 |
| 3-5 years (Mid Career) | $58,658 – $72,303 |
| 5+ years (Experienced) | $72,303 – $92,548 |
| 10+ years (Top Earner) | $92,548 – $112,070 |
Plumber salary ranges estimated from BLS percentile data. Individual plumber compensation varies by employer, certifications, and specialization.
Plumber Job Market in Hackensack
The local job market for plumbers in Hackensack comprises about eight employed individuals, reflective of a tighter labor pool amidst a cost-of-living index of 115.2, which suggests that living expenses are above the national average. This index indicates that plumbers need to maximize their earning potential to maintain a comfortable standard of living. Employers that tend to pay the highest include union plumbing contractors, industrial maintenance teams, and larger service companies like Roto-Rooter and ARS. Significant wage disparities arise from various factors, such as the preference for union labor, specialization certifications, and experience levels. For those seeking to optimize their plumber pay in Hackensack, pursuing advanced licenses, honing skills in high-demand areas, and exploring opportunities within unionized settings can significantly influence total compensation in this competitive market.
More salary data for Hackensack, NJ:
Frequently Asked Questions
How much do plumbers make in Hackensack, NJ in 2026?
Is Hackensack, NJ a good place to work as a plumber?
Can plumbers make $100K in Hackensack?
What is the cost-of-living adjusted plumber salary in Hackensack?
How much does a plumber make per hour in Hackensack?
Related Pages
Compare Salaries
Career Resources
Nearby Cities in New Jersey
Written by Samuel Torres, CWP
Career Analyst
Samuel Torres has 10 years of experience in plumbing. He specializes in residential plumbing systems. He has worked with several home improvement companies.
Methodology & Data Source
Salary figures on this page are 2026 projections based on the Bureau of Labor Statistics Occupational Employment and Wage Statistics (OEWS) survey, May 2026 release. The BLS reported a median annual salary of $70,526 for plumbersin the Hackensack metropolitan area. A 2.52% compound annual growth rate (CAGR), calculated from 6-year national BLS wage trends, was applied to project current 2026 compensation. Percentile ranges (P10–P90) represent the full salary distribution across experience levels and practice settings in this market.
Data Sources & Methodology
Salary data for Hackensack is estimated from official BLS state-level occupational wage data (2025), adjusted for regional cost-of-living differences using BEA RPP (Regional Price Parities).
2026 figures are projected from 2025 BLS data using a compound annual growth rate (CAGR) of 2.52%, derived from historical BLS wage trends for plumbers (SOC 47-2152).
Compiled and verified by Samuel Torres, CWP, a licensed plumber with 10+ years of clinical experience. · View source data at BLS.gov