Plumber Salary in New Hampshire: $69,190 (2026)
Quick Answer:Across New Hampshire's 16 metropolitan areas, the average median plumber pay sits at $69,190/year heading into 2026 — a figure projected from 2025 BLS OEWS wage data for SOC 47-2152. Because New Hampshire sits at BEA RPP 107.3 (7% above the U.S. baseline), that statewide median translates to roughly $64,483 in nationally-comparable purchasing power. Highest-paying metros: Nashua ($68,169), Manchester ($67,690), Salem ($66,804).
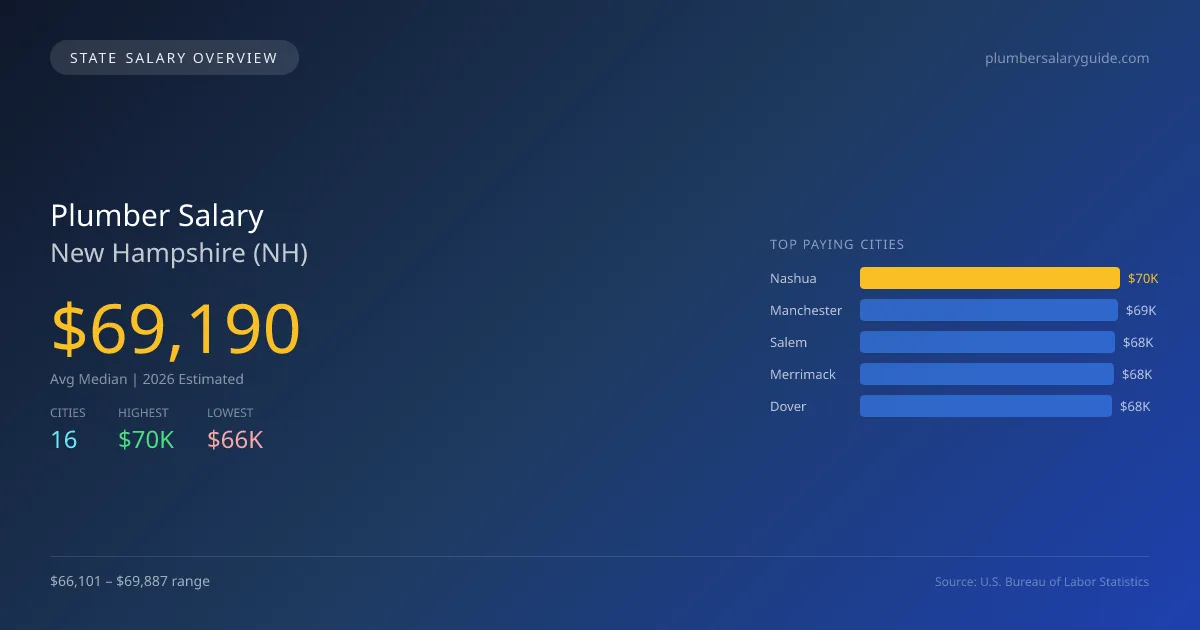
In New Hampshire, the average median salary for plumbers in 2026 is projected to be $69,190, which is 5.8% higher than the national median of $65,408. The highest-paying city for plumbers is Nashua at $69,887, while Bedford offers the lowest salary at $66,101. This $3,786 gap can be attributed to the cost of living, demand for plumbing services, and the presence of larger commercial projects in urban areas versus smaller residential work in suburban regions. The state requires plumbers to hold a license, which involves completing an approved training program and passing an examination. This ensures a qualified workforce but can limit the number of new entrants into the field. Factors driving demand in New Hampshire include ongoing infrastructure projects, a growing population, and the need for maintenance on aging systems, all contributing to a projected annual growth rate of 2.52%. With a total of 765 plumbers employed, the job market shows promise, particularly in cities like Manchester with a projected salary of $69,396, and Salem at $68,487. Given the overall favorable salary projections and consistent demand, pursuing a career in plumbing in New Hampshire appears to be a sound decision for the coming years.
New Hampshire Plumber Salary Range
Overall salary range in New Hampshire: $46,038 (lowest entry-level) to $108,325 (highest top earner)
New Hampshire vs National Average
New Hampshire plumbers earn 5.78% more than the national median (+$3,782/year difference).
New Hampshire Plumber Salary Distribution (2026)
Plumber salaries in New Hampshire range from $47,270 (entry-level, 10th percentile) to $95,269 (top earners, 90th percentile), with a median of $69,190. The New Hampshire median is $3,782 above the US national median of $65,408. The average hourly rate is $33.26/hr. Approximately 765 plumbers are employed across 16 cities.
2019 BLS Actual
$51,813
2025 BLS Actual
$67,489
2026 Current Est.
$69,190
2019–2027 Growth
+36.9%
Salary Trajectory for Plumbers in New Hampshire (2019–2027)
2019–2025: actual BLS OEWS data for this metro area. 2026+: CAGR 2.52% projection.
| Year | Annual Salary | Status |
|---|---|---|
| 2019 | $51,813 | Actual |
| 2020 | $54,867 | Actual |
| 2021 | $59,061 | Actual |
| 2022 | $59,928 | Actual |
| 2023 | $63,326 | Actual |
| 2024 | $67,292 | Actual |
| 2025 | $67,489 | Actual |
| 2026(current) | $69,190 | Estimated |
| 2027 | $70,934 | Projected |
Based on 7 years of BLS OEWS data for the New Hampshire metropolitan area, the median plumber salary grew 30.3% from $51,813 (2019) to $67,489 (2025). At a 2.52% compound annual growth rate, salaries are projected to reach $70,934 by 2027 — a total increase of $19,121 (36.90%) from 2019.
Note: Historical values (2019–2025) are actual BLS OEWS figures for the New Hampshire metropolitan area, sourced from annual Occupational Employment and Wage Statistics surveys. 2026–2026 figures are current estimates, and 2027 values are projections, calculated using a 2.52% CAGR derived from 7-year BLS historical data. Actual salaries may vary based on employer, experience, certifications, and local market conditions.
Top 5 Highest Paying Cities in New Hampshire
Lowest Paying Cities in New Hampshire
Best Value Cities for Plumbers in New Hampshire
When adjusted for local cost of living, these New Hampshire cities offer the most purchasing power for plumbers.
| City | Nominal Salary | CoL Index | Adjusted Salary |
|---|---|---|---|
| Manchester | $69,396 | 105.657 | $65,680 |
| Nashua | $69,887 | 107.3 | $65,132 |
| Salem | $68,487 | 107.3 | $63,828 |
| Merrimack | $68,400 | 107.3 | $63,747 |
| Dover | $67,861 | 107.3 | $63,244 |
Adjusted salary = nominal salary × (100 / CoL index). CoL index: 100 = national average. Lower index = lower cost of living.
Salary by Experience Level in New Hampshire
| Experience Level | Estimated Annual |
|---|---|
| Entry Level (0-2 years) | $47,270 |
| Mid Career (3-7 years) | $69,190 |
| Experienced (7+ years) | $95,269 |
Estimates based on BLS percentile data averaged across New Hampshire metro areas. Individual pay varies by employer, certifications, and specialization.
All 16 Cities in New Hampshire
More New Hampshire Salary Data
Explore More Plumber Salary Data
Frequently Asked Questions
How much do plumbers make in New Hampshire in 2026?
What is the highest paying city for plumbers in New Hampshire?
How does New Hampshire plumber pay compare to the national average?
What is the entry-level plumber salary in New Hampshire?
How many plumbers are employed in New Hampshire?
Which New Hampshire city offers the best value for plumbers?
Written by Samuel Torres, CWP
Career Analyst
Samuel Torres has 10 years of experience in plumbing. He specializes in residential plumbing systems. He has worked with several home improvement companies.
Methodology & Data Source
Statewide salary figures on this page are 2026 projections based on the Bureau of Labor Statistics Occupational Employment and Wage Statistics (OEWS) survey, May 2026 release. A 2.52% compound annual growth rate (CAGR), derived from 6-year national BLS wage trends, was applied to each metro area's reported salary to estimate current 2026 plumber compensation across New Hampshire. State averages are employment-weighted across 16 metro areas — larger metro areas with more plumberscontribute proportionally more to the average, producing figures that better reflect typical compensation. Individual pay varies by city, employer, certifications, and experience.
Data Sources & Methodology
Source: BLS, OEWS, 7-year dataset (–). Per-city data from annual BLS metropolitan area surveys.
2026 figures are projected from 2025 BLS data using a compound annual growth rate (CAGR) of 2.52%, derived from historical BLS wage trends for plumbers (SOC 47-2152).
Compiled and verified by Samuel Torres, CWP, a licensed plumber with 10+ years of clinical experience. · View source data at BLS.gov