Plumber Salary in Severn, MD: $69,923 (2026)
Quick Answer:A full-time plumber in Severn, MD earns a median $69,923/year (≈ $33.62/hour) in nominal terms for 2026 — projected from BLS OEWS 2025 (SOC 47-2152). Once you factor in Severn's price level (9% above national, BEA RPP 109.3), that paycheck buys what $63,973 would nationally. Nominal pay sits 2.2% below the Maryland state average.
Based on BLS state-level estimates · View source
In 2026, plumbers in Severn, MD, can expect a median annual salary of $69,923, reflecting a noteworthy 6.90% increase compared to the national median of $65,408. The salary range in the area shows significant variability, with earnings stretching from $50,021 at the lower end (P10) to $108,380 at the high end (P90). Local salary estimates, rooted in BLS state-level data and adjusted for the region's cost of living index of 109.3, suggest that union pipefitters, particularly those associated with the United Association (UA), typically command higher wages compared to their non-union counterparts. This disparity indicates a labor market in Severn where union affiliations significantly influence compensation rates, with specialized skills such as medical gas fitting commanding even more lucrative pay.
About the Severn Market
Salary estimated from Maryland average ($68,000) adjusted for local cost of living.
Salary Breakdown
| Percentile | Annual | Hourly |
|---|---|---|
| Entry Level (P10) | $50,021 | $24.05 |
| Lower Range (P25) | $55,762 | $26.81 |
| Median (P50)(typical) | $69,923 | $33.62 |
| Upper Range (P75) | $89,501 | $43.03 |
| Top Earners (P90) | $108,380 | $52.11 |
Median Salary Position
6.90% above the national average
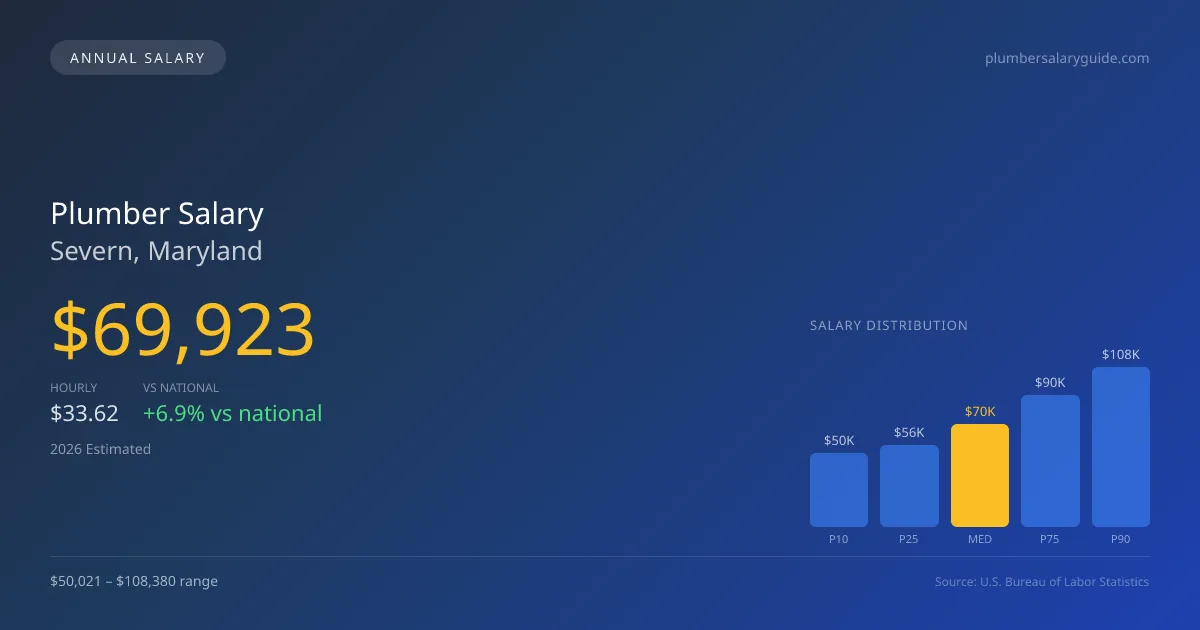
2026 Salary Percentile Distribution in Severn
In Severn, MD, the plumber salary spread from the 10th to 90th percentile is $58,359 (2026 est.). At $69,923, the local median is 6.9% above the national median of $65,408.
Salary Calculator
At 40 hours/week in Severn: You'd be in the lower-middle range
How Severn Plumber Pay Compares
Severn median: $69,923/year (2026)
| Compared To | Median Salary | Severn Pays |
|---|---|---|
| Maryland Average | $71,496 | -2.20% less |
| National Average | $65,408 | +6.90% more |
Plumbers in Severn, MD earn a median of $69,923 per year (2026 est.), which is 6.90% higher than the national median of $65,408 and 2.20% below the Maryland state average of $71,496.
Cost-of-Living Adjusted Salary
Severn has a cost of living 9.30% above the national average.
Adjusted salary = nominal × (100 / CoL index). CoL index: 100 = national average.
Severn, MD has a cost-of-living index of 109.3 (above the national average of 100). While the nominal salary of $69,923 is competitive, the higher cost of living reduces purchasing power to an effective $63,973 — a 8.51% reduction.
Compare Purchasing Power
Select a city to see how your salary compares after cost of living
Select a city above to compare purchasing power
2019 BLS Actual
$58,968
2025 BLS Actual
$68,204
2026 Current Est.
$69,923
2019–2027 Growth
+21.6%
Salary Trajectory for Plumbers in Severn (2019–2027)
2019–2025: actual BLS OEWS data for this metro area. 2026+: CAGR 2.52% projection.
| Year | Annual Salary | Status |
|---|---|---|
| 2019 | $58,968 | Actual |
| 2020 | $60,218 | Actual |
| 2021 | $64,013 | Actual |
| 2022 | $64,238 | Actual |
| 2023 | $65,799 | Actual |
| 2024 | $72,695 | Actual |
| 2025 | $68,204 | Actual |
| 2026(current) | $69,923 | Estimated |
| 2027 | $71,685 | Projected |
Based on 7 years of BLS OEWS data for the Severn metropolitan area, the median plumber salary grew 15.7% from $58,968 (2019) to $68,204 (2025). At a 2.52% compound annual growth rate, salaries are projected to reach $71,685 by 2027 — a total increase of $12,717 (21.57%) from 2019.
Note: Historical values (2019–2025) are actual BLS OEWS figures for the Severn metropolitan area, sourced from annual Occupational Employment and Wage Statistics surveys. 2026–2026 figures are current estimates, and 2027 values are projections, calculated using a 2.52% CAGR derived from 7-year BLS historical data. Actual salaries may vary based on employer, experience, certifications, and local market conditions.
Salary by Experience Level
| Experience | Estimated Salary Range |
|---|---|
| 0-2 years (New Graduate) | $50,021 – $55,762 |
| 3-5 years (Mid Career) | $55,762 – $69,923 |
| 5+ years (Experienced) | $69,923 – $89,501 |
| 10+ years (Top Earner) | $89,501 – $108,380 |
Plumber salary ranges estimated from BLS percentile data. Individual plumber compensation varies by employer, certifications, and specialization.
Plumber Job Market in Severn
The job market for plumbers in Severn currently employs 12 professionals, underlining a niche but vital segment of the local economy. The cost of living in the area, with a CoL index over the national average, impacts the real purchasing power of plumber salaries, suggesting that careful budgeting may be necessary. Among the top earners, union plumbing contractors tend to outrank non-union service companies, such as Roto-Rooter and ARS, although commission-based remuneration can provide significant upside for those entering the residential service sector. Specialties, particularly in areas like medical gas and industrial maintenance, are associated with higher earnings, reflecting the complexity and skill required for these roles. For those in Severn looking to maximize their earnings, pursuing additional credentials and union membership can be advantageous, especially considering the advantages of a master or contractor license for self-employed individuals in a competitive market where the average plumber's age indicates an impending labor shortage.
More salary data for Severn, MD:
Frequently Asked Questions
How much do plumbers make in Severn, MD in 2026?
Is Severn, MD a good place to work as a plumber?
Can plumbers make $100K in Severn?
What is the cost-of-living adjusted plumber salary in Severn?
How much does a plumber make per hour in Severn?
Related Pages
Compare Salaries
Career Resources
Nearby Cities in Maryland
Written by Samuel Torres, CWP
Career Analyst
Samuel Torres has 10 years of experience in plumbing. He specializes in residential plumbing systems. He has worked with several home improvement companies.
Methodology & Data Source
Salary figures on this page are 2026 projections based on the Bureau of Labor Statistics Occupational Employment and Wage Statistics (OEWS) survey, May 2026 release. The BLS reported a median annual salary of $68,204 for plumbersin the Severn metropolitan area. A 2.52% compound annual growth rate (CAGR), calculated from 6-year national BLS wage trends, was applied to project current 2026 compensation. Percentile ranges (P10–P90) represent the full salary distribution across experience levels and practice settings in this market.
Data Sources & Methodology
Salary data for Severn is estimated from official BLS state-level occupational wage data (2025), adjusted for regional cost-of-living differences using BEA RPP (Regional Price Parities).
2026 figures are projected from 2025 BLS data using a compound annual growth rate (CAGR) of 2.52%, derived from historical BLS wage trends for plumbers (SOC 47-2152).
Compiled and verified by Samuel Torres, CWP, a licensed plumber with 10+ years of clinical experience. · View source data at BLS.gov