Plumber Salary in Marshalltown, IA: $61,524 (2026)
Quick Answer:A full-time plumber in Marshalltown, IA earns a median $61,524/year (≈ $29.58/hour) in nominal terms for 2026 — projected from BLS OEWS 2025 (SOC 47-2152). Once you factor in Marshalltown's price level (10% below national, BEA RPP 90.4), that paycheck buys what $68,058 would nationally. Nominal pay sits 4.8% below the Iowa state average.
Based on BLS state-level estimates · View source
In Marshalltown, IA, the projected median annual plumber salary is expected to reach $61,524 by 2026, which is approximately 5.94% lower than the national median of $65,408. With salaries ranging from $44,822 at the 10th percentile to $95,363 at the 90th percentile, these figures illustrate the variability in compensation within the profession. Plumber pay in Marshalltown is heavily influenced by whether individuals are part of a union or not, with UA union pipefitters typically earning 30-50% more than their non-union counterparts. This dynamic creates a competitive job market where specialization and union affiliation can significantly affect earnings potential.
About the Marshalltown Market
Salary estimated from Iowa average ($62,000) adjusted for local cost of living.
Salary Breakdown
| Percentile | Annual | Hourly |
|---|---|---|
| Entry Level (P10) | $44,822 | $21.55 |
| Lower Range (P25) | $47,994 | $23.08 |
| Median (P50)(typical) | $61,524 | $29.58 |
| Upper Range (P75) | $78,751 | $37.86 |
| Top Earners (P90) | $95,363 | $45.85 |
Median Salary Position
5.94% below the national average
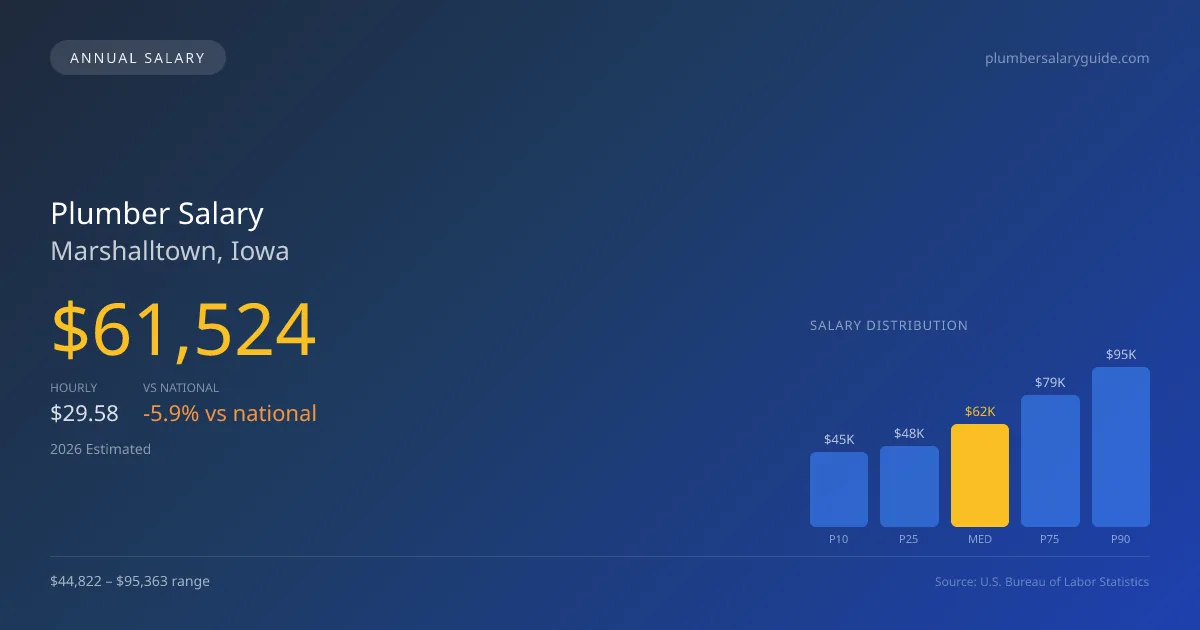
2026 Salary Percentile Distribution in Marshalltown
In Marshalltown, IA, the plumber salary spread from the 10th to 90th percentile is $50,541 (2026 est.). At $61,524, the local median is 5.94% below the national median of $65,408.
Salary Calculator
At 40 hours/week in Marshalltown: You'd be in the lower-middle range
How Marshalltown Plumber Pay Compares
Marshalltown median: $61,524/year (2026)
| Compared To | Median Salary | Marshalltown Pays |
|---|---|---|
| Iowa Average | $64,626 | -4.80% less |
| National Average | $65,408 | -5.94% less |
Plumbers in Marshalltown, IA earn a median of $61,524 per year (2026 est.), which is 5.94% lower than the national median of $65,408 and 4.80% below the Iowa state average of $64,626.
Cost-of-Living Adjusted Salary
Marshalltown has a cost of living 9.60% below the national average, meaning your salary goes further here.
Adjusted salary = nominal × (100 / CoL index). CoL index: 100 = national average.
Marshalltown, IA has a cost-of-living index of 90.4 (below the national average of 100). A plumber earning $61,524 nominally has purchasing power equivalent to $68,058 in an average-cost city — an effective 10.62% boost.
Compare Purchasing Power
Select a city to see how your salary compares after cost of living
Select a city above to compare purchasing power
2019 BLS Actual
$51,885
2025 BLS Actual
$60,012
2026 Current Est.
$61,524
2019–2027 Growth
+21.6%
Salary Trajectory for Plumbers in Marshalltown (2019–2027)
2019–2025: actual BLS OEWS data for this metro area. 2026+: CAGR 2.52% projection.
| Year | Annual Salary | Status |
|---|---|---|
| 2019 | $51,885 | Actual |
| 2020 | $52,986 | Actual |
| 2021 | $56,325 | Actual |
| 2022 | $56,522 | Actual |
| 2023 | $57,896 | Actual |
| 2024 | $53,381 | Actual |
| 2025 | $60,012 | Actual |
| 2026(current) | $61,524 | Estimated |
| 2027 | $63,075 | Projected |
Based on 7 years of BLS OEWS data for the Marshalltown metropolitan area, the median plumber salary grew 15.7% from $51,885 (2019) to $60,012 (2025). At a 2.52% compound annual growth rate, salaries are projected to reach $63,075 by 2027 — a total increase of $11,190 (21.57%) from 2019.
Note: Historical values (2019–2025) are actual BLS OEWS figures for the Marshalltown metropolitan area, sourced from annual Occupational Employment and Wage Statistics surveys. 2026–2026 figures are current estimates, and 2027 values are projections, calculated using a 2.52% CAGR derived from 7-year BLS historical data. Actual salaries may vary based on employer, experience, certifications, and local market conditions.
Salary by Experience Level
| Experience | Estimated Salary Range |
|---|---|
| 0-2 years (New Graduate) | $44,822 – $47,994 |
| 3-5 years (Mid Career) | $47,994 – $61,524 |
| 5+ years (Experienced) | $61,524 – $78,751 |
| 10+ years (Top Earner) | $78,751 – $95,363 |
Plumber salary ranges estimated from BLS percentile data. Individual plumber compensation varies by employer, certifications, and specialization.
Plumber Job Market in Marshalltown
As of 2026, Marshalltown has around eight plumbers actively employed in the local market, which contributes to a more intimate job landscape. The cost of living in the area sits at a lower index of 90.4, reflecting that the purchasing power for plumbers can stretch further than in markets with higher costs. Within the community, UA union plumbing contractors tend to offer the highest salaries, followed by larger service companies like Roto-Rooter and ARS, which often provide commission-based structures that can enhance income for skilled workers. Those looking to increase their pay should consider obtaining specialty certifications, such as medical gas or backflow prevention, and explore opportunities in industrial maintenance or taking on private contracts for greater margins. Understanding the pay structure and efficiencies in Marshalltown’s plumbing market will be essential for maximizing earnings and securing stable employment.
More salary data for Marshalltown, IA:
Frequently Asked Questions
How much do plumbers make in Marshalltown, IA in 2026?
Is Marshalltown, IA a good place to work as a plumber?
Can plumbers make $100K in Marshalltown?
What is the cost-of-living adjusted plumber salary in Marshalltown?
How much does a plumber make per hour in Marshalltown?
Related Pages
Compare Salaries
Career Resources
Written by Samuel Torres, CWP
Career Analyst
Samuel Torres has 10 years of experience in plumbing. He specializes in residential plumbing systems. He has worked with several home improvement companies.
Methodology & Data Source
Salary figures on this page are 2026 projections based on the Bureau of Labor Statistics Occupational Employment and Wage Statistics (OEWS) survey, May 2026 release. The BLS reported a median annual salary of $60,012 for plumbersin the Marshalltown metropolitan area. A 2.52% compound annual growth rate (CAGR), calculated from 6-year national BLS wage trends, was applied to project current 2026 compensation. Percentile ranges (P10–P90) represent the full salary distribution across experience levels and practice settings in this market.
Data Sources & Methodology
Salary data for Marshalltown is estimated from official BLS state-level occupational wage data (2025), adjusted for regional cost-of-living differences using BEA RPP (Regional Price Parities).
2026 figures are projected from 2025 BLS data using a compound annual growth rate (CAGR) of 2.52%, derived from historical BLS wage trends for plumbers (SOC 47-2152).
Compiled and verified by Samuel Torres, CWP, a licensed plumber with 10+ years of clinical experience. · View source data at BLS.gov