Plumber Salary in Arlington Heights, IL: $90,457 (2026)
Quick Answer:A full-time plumber in Arlington Heights, IL earns a median $90,457/year (≈ $43.49/hour) in nominal terms for 2026 — projected from BLS OEWS 2025 (SOC 47-2152). Once you factor in Arlington Heights's price level (3% below national, BEA RPP 97.1), that paycheck buys what $93,159 would nationally. Nominal pay sits 1.6% below the Illinois state average.
Based on BLS state-level estimates · View source
In Arlington Heights, IL, the vibrant labor market for plumbers reflects a clear distinction in compensation based on union affiliation. There is a notable disparity in plumber salaries, with union pipefitters seeing annual earnings that can exceed those of their non-union counterparts. In 2026, the projected median annual wage stands at $90,457, while the salary range spans from $65,683 at the lower end to $140,209 at the top percentile. These figures are derived from state-level estimates adjusted for local pricing conditions, indicating how market dynamics influence wages. The demand for plumbing services—bolstered by an aging infrastructure and an increasingly skilled workforce—suggests a steady job outlook in this sector, particularly for those who hold specialty credentials.
About the Arlington Heights Market
Salary estimated from Illinois average ($90,000) adjusted for local cost of living.
Salary Breakdown
| Percentile | Annual | Hourly |
|---|---|---|
| Entry Level (P10) | $65,683 | $31.58 |
| Lower Range (P25) | $72,797 | $35.00 |
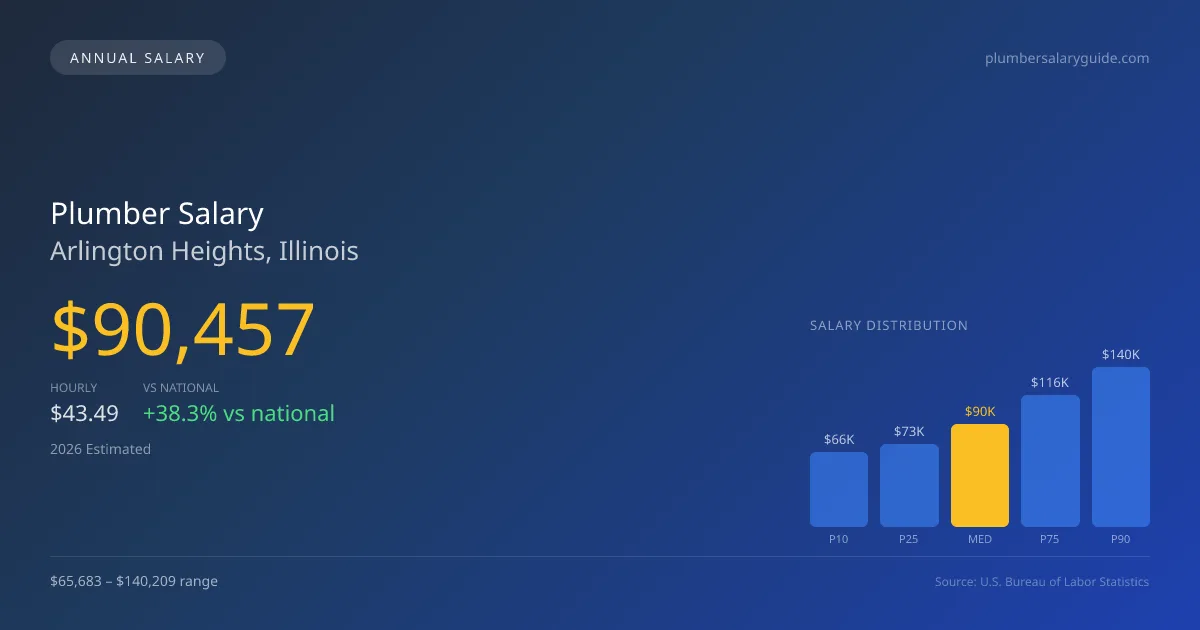
| Median (P50)(typical) | $90,457 | $43.49 |
| Upper Range (P75) | $115,786 | $55.67 |
| Top Earners (P90) | $140,209 | $67.41 |
Median Salary Position
38.30% above the national average
2026 Salary Percentile Distribution in Arlington Heights
In Arlington Heights, IL, the plumber salary spread from the 10th to 90th percentile is $74,526 (2026 est.). At $90,457, the local median is 38.3% above the national median of $65,408.
Salary Calculator
At 40 hours/week in Arlington Heights: You'd be in the lower-middle range
How Arlington Heights Plumber Pay Compares
Arlington Heights median: $90,457/year (2026)
| Compared To | Median Salary | Arlington Heights Pays |
|---|---|---|
| Illinois Average | $91,928 | -1.60% less |
| National Average | $65,408 | +38.30% more |
Plumbers in Arlington Heights, IL earn a median of $90,457 per year (2026 est.), which is 38.30% higher than the national median of $65,408 and 1.60% below the Illinois state average of $91,928.
Cost-of-Living Adjusted Salary
Arlington Heights has a cost of living 2.90% below the national average, meaning your salary goes further here.
Adjusted salary = nominal × (100 / CoL index). CoL index: 100 = national average.
Arlington Heights, IL has a cost-of-living index of 97.1 (below the national average of 100). A plumber earning $90,457 nominally has purchasing power equivalent to $93,159 in an average-cost city — an effective 2.99% boost.
Compare Purchasing Power
Select a city to see how your salary compares after cost of living
Select a city above to compare purchasing power
2019 BLS Actual
$76,285
2025 BLS Actual
$88,234
2026 Current Est.
$90,457
2019–2027 Growth
+21.6%
Salary Trajectory for Plumbers in Arlington Heights (2019–2027)
2019–2025: actual BLS OEWS data for this metro area. 2026+: CAGR 2.52% projection.
| Year | Annual Salary | Status |
|---|---|---|
| 2019 | $76,285 | Actual |
| 2020 | $77,903 | Actual |
| 2021 | $82,813 | Actual |
| 2022 | $83,103 | Actual |
| 2023 | $85,122 | Actual |
| 2024 | $86,000 | Actual |
| 2025 | $88,234 | Actual |
| 2026(current) | $90,457 | Estimated |
| 2027 | $92,737 | Projected |
Based on 7 years of BLS OEWS data for the Arlington Heights metropolitan area, the median plumber salary grew 15.7% from $76,285 (2019) to $88,234 (2025). At a 2.52% compound annual growth rate, salaries are projected to reach $92,737 by 2027 — a total increase of $16,452 (21.57%) from 2019.
Note: Historical values (2019–2025) are actual BLS OEWS figures for the Arlington Heights metropolitan area, sourced from annual Occupational Employment and Wage Statistics surveys. 2026–2026 figures are current estimates, and 2027 values are projections, calculated using a 2.52% CAGR derived from 7-year BLS historical data. Actual salaries may vary based on employer, experience, certifications, and local market conditions.
Salary by Experience Level
| Experience | Estimated Salary Range |
|---|---|
| 0-2 years (New Graduate) | $65,683 – $72,797 |
| 3-5 years (Mid Career) | $72,797 – $90,457 |
| 5+ years (Experienced) | $90,457 – $115,786 |
| 10+ years (Top Earner) | $115,786 – $140,209 |
Plumber salary ranges estimated from BLS percentile data. Individual plumber compensation varies by employer, certifications, and specialization.
Plumber Job Market in Arlington Heights
With only 18 plumbers currently employed in Arlington Heights, competition for available roles can be fierce, yet the cost-of-living index at 97.1 indicates a favorable environment for those in the trade. This lower index allows wages to stretch further, providing better purchasing power compared to other regions. Employers that tend to offer higher salaries include UA union contractors, who maintain a competitive advantage, particularly in specialty fields such as hospital plumbing which requires medical gas certifications. Understanding the nuances of pay differentiation, such as the added value of master licenses or overtime opportunities, remains crucial for aspiring professionals. For those seeking to maximize their plumber pay in Arlington Heights, leveraging experience in high-demand areas like industrial maintenance or securing commission-based roles with larger service companies can prove advantageous.
More salary data for Arlington Heights, IL:
Frequently Asked Questions
How much do plumbers make in Arlington Heights, IL in 2026?
Is Arlington Heights, IL a good place to work as a plumber?
Can plumbers make $100K in Arlington Heights?
What is the cost-of-living adjusted plumber salary in Arlington Heights?
How much does a plumber make per hour in Arlington Heights?
Related Pages
Compare Salaries
Career Resources
Nearby Cities in Illinois
Written by Samuel Torres, CWP
Career Analyst
Samuel Torres has 10 years of experience in plumbing. He specializes in residential plumbing systems. He has worked with several home improvement companies.
Methodology & Data Source
Salary figures on this page are 2026 projections based on the Bureau of Labor Statistics Occupational Employment and Wage Statistics (OEWS) survey, May 2026 release. The BLS reported a median annual salary of $88,234 for plumbersin the Arlington Heights metropolitan area. A 2.52% compound annual growth rate (CAGR), calculated from 6-year national BLS wage trends, was applied to project current 2026 compensation. Percentile ranges (P10–P90) represent the full salary distribution across experience levels and practice settings in this market.
Data Sources & Methodology
Salary data for Arlington Heights is estimated from official BLS state-level occupational wage data (2025), adjusted for regional cost-of-living differences using BEA RPP (Regional Price Parities).
2026 figures are projected from 2025 BLS data using a compound annual growth rate (CAGR) of 2.52%, derived from historical BLS wage trends for plumbers (SOC 47-2152).
Compiled and verified by Samuel Torres, CWP, a licensed plumber with 10+ years of clinical experience. · View source data at BLS.gov