Plumber Salary in Yucaipa, CA: $65,054 (2026)
Quick Answer:A full-time plumber in Yucaipa, CA earns a median $65,054/year (≈ $31.28/hour) in nominal terms for 2026 — projected from BLS OEWS 2025 (SOC 47-2152). Once you factor in Yucaipa's price level (13% above national, BEA RPP 113.1), that paycheck buys what $57,519 would nationally. Nominal pay sits 0.7% below the California state average.
Based on BLS state-level estimates · View source
In Yucaipa, California, the plumber salary is projected at a median of $65,054 for 2026. This figure highlights the significant disparity in earnings between union pipefitters, who often earn more due to their specialized skills and collective bargaining agreements, and non-union service plumbers. The salary range for plumbers in this market varies widely, with the lower 10% earning about $42,941 and the top 90% making as much as $100,834. Local estimates from 2025 BLS data, adjusted for regional price levels, inform these projections, and demonstrate competitive compensation relative to the broader market. With approximately 14 plumbers currently employed in Yucaipa, this localized field offers distinct opportunities based on skill levels and working conditions that influence overall pay.
About the Yucaipa Market
Salary estimated from California average ($82,000) adjusted for local cost of living.
Salary Breakdown
| Percentile | Annual | Hourly |
|---|---|---|
| Entry Level (P10) | $42,941 | $20.65 |
| Lower Range (P25) | $53,035 | $25.50 |
| Median (P50)(typical) | $65,054 | $31.28 |
| Upper Range (P75) | $83,269 | $40.03 |
| Top Earners (P90) | $100,834 | $48.48 |
Median Salary Position
0.54% below the national average
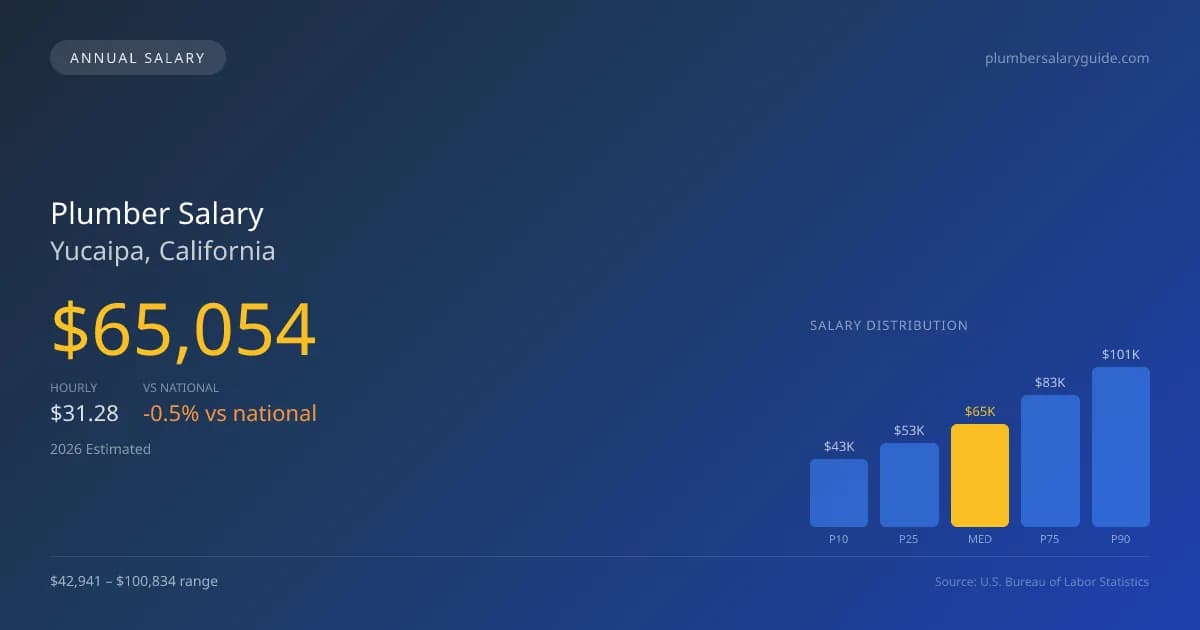
2026 Salary Percentile Distribution in Yucaipa
In Yucaipa, CA, the plumber salary spread from the 10th to 90th percentile is $57,893 (2026 est.). At $65,054, the local median is 0.54% below the national median of $65,408.
Salary Calculator
At 40 hours/week in Yucaipa: You'd be in the lower-middle range
How Yucaipa Plumber Pay Compares
Yucaipa median: $65,054/year (2026)
| Compared To | Median Salary | Yucaipa Pays |
|---|---|---|
| California Average | $65,513 | -0.70% less |
| National Average | $65,408 | -0.54% less |
Plumbers in Yucaipa, CA earn a median of $65,054 per year (2026 est.), which is 0.54% lower than the national median of $65,408 and 0.70% below the California state average of $65,513.
Cost-of-Living Adjusted Salary
Yucaipa has a cost of living 13.10% above the national average.
Adjusted salary = nominal × (100 / CoL index). CoL index: 100 = national average.
Yucaipa, CA has a cost-of-living index of 113.1 (above the national average of 100). While the nominal salary of $65,054 is competitive, the higher cost of living reduces purchasing power to an effective $57,519 — a 11.58% reduction.
Compare Purchasing Power
Select a city to see how your salary compares after cost of living
Select a city above to compare purchasing power
2019 BLS Actual
$54,862
2025 BLS Actual
$63,455
2026 Current Est.
$65,054
2019–2027 Growth
+21.6%
Salary Trajectory for Plumbers in Yucaipa (2019–2027)
2019–2025: actual BLS OEWS data for this metro area. 2026+: CAGR 2.52% projection.
| Year | Annual Salary | Status |
|---|---|---|
| 2019 | $54,862 | Actual |
| 2020 | $56,025 | Actual |
| 2021 | $59,556 | Actual |
| 2022 | $59,765 | Actual |
| 2023 | $61,217 | Actual |
| 2024 | $92,068 | Actual |
| 2025 | $63,455 | Actual |
| 2026(current) | $65,054 | Estimated |
| 2027 | $66,693 | Projected |
Based on 7 years of BLS OEWS data for the Yucaipa metropolitan area, the median plumber salary grew 15.7% from $54,862 (2019) to $63,455 (2025). At a 2.52% compound annual growth rate, salaries are projected to reach $66,693 by 2027 — a total increase of $11,831 (21.57%) from 2019.
Note: Historical values (2019–2025) are actual BLS OEWS figures for the Yucaipa metropolitan area, sourced from annual Occupational Employment and Wage Statistics surveys. 2026–2026 figures are current estimates, and 2027 values are projections, calculated using a 2.52% CAGR derived from 7-year BLS historical data. Actual salaries may vary based on employer, experience, certifications, and local market conditions.
Salary by Experience Level
| Experience | Estimated Salary Range |
|---|---|
| 0-2 years (New Graduate) | $42,941 – $53,035 |
| 3-5 years (Mid Career) | $53,035 – $65,054 |
| 5+ years (Experienced) | $65,054 – $83,269 |
| 10+ years (Top Earner) | $83,269 – $100,834 |
Plumber salary ranges estimated from BLS percentile data. Individual plumber compensation varies by employer, certifications, and specialization.
Plumber Job Market in Yucaipa
To understand how the local job market for plumbers plays out in Yucaipa, one must consider the cost of living, which has an index of 113.1, above the national average. This inflationary pressure can impact take-home pay and purchasing power significantly. The most competitive wages often come from union plumbing contractors, particularly those affiliated with the UA (United Association), as well as specialized service companies and industrial maintenance teams. The gap in earnings can often be attributed to several factors: union contracts generally provide higher pay compared to open-shop employers, while specific specialties like medical gas installation or industrial pipefitting command premium rates. To maximize earnings in Yucaipa, plumbers should pursue additional certifications and specialties, seek roles within union operations, or engage in self-employment where they can set their rates and keep a larger share of their income.
More salary data for Yucaipa, CA:
Frequently Asked Questions
How much do plumbers make in Yucaipa, CA in 2026?
Is Yucaipa, CA a good place to work as a plumber?
Can plumbers make $100K in Yucaipa?
What is the cost-of-living adjusted plumber salary in Yucaipa?
How much does a plumber make per hour in Yucaipa?
Related Pages
Compare Salaries
Career Resources
Nearby Cities in California
Written by Samuel Torres, CWP
Career Analyst
Samuel Torres has 10 years of experience in plumbing. He specializes in residential plumbing systems. He has worked with several home improvement companies.
Methodology & Data Source
Salary figures on this page are 2026 projections based on the Bureau of Labor Statistics Occupational Employment and Wage Statistics (OEWS) survey, May 2026 release. The BLS reported a median annual salary of $63,455 for plumbersin the Yucaipa metropolitan area. A 2.52% compound annual growth rate (CAGR), calculated from 6-year national BLS wage trends, was applied to project current 2026 compensation. Percentile ranges (P10–P90) represent the full salary distribution across experience levels and practice settings in this market.
Data Sources & Methodology
Salary data for Yucaipa is estimated from official BLS state-level occupational wage data (2025), adjusted for regional cost-of-living differences using BEA RPP (Regional Price Parities).
2026 figures are projected from 2025 BLS data using a compound annual growth rate (CAGR) of 2.52%, derived from historical BLS wage trends for plumbers (SOC 47-2152).
Compiled and verified by Samuel Torres, CWP, a licensed plumber with 10+ years of clinical experience. · View source data at BLS.gov