Plumber Salary in Woodland, CA: $66,372 (2026)
Quick Answer:A full-time plumber in Woodland, CA earns a median $66,372/year (≈ $31.91/hour) in nominal terms for 2026 — projected from BLS OEWS 2025 (SOC 47-2152). Once you factor in Woodland's price level (13% above national, BEA RPP 113.1), that paycheck buys what $58,684 would nationally. Nominal pay sits 1.3% above the California state average.
Based on BLS state-level estimates · View source
With a projected median annual salary of $66,372 for plumbers in Woodland, California, this figure reflects a competitive stance against the national median of $65,408. The salary range for this profession spans from $45,900 at the 10th percentile to $102,878 at the 90th percentile, indicating significant income potential based on skills, experience, and employment type. These estimates, derived from 2025 BLS data and adjusted for regional cost factors, suggest a varied landscape for plumber pay in Woodland, influenced heavily by whether one operates as an independent contractor or remains within the employed service plumbing sector. As the demand for plumbing services persists, job opportunities remain steady, particularly for skilled tradespeople in this vibrant California city.
About the Woodland Market
Salary estimated from California average ($82,000) adjusted for local cost of living.
Salary Breakdown
| Percentile | Annual | Hourly |
|---|---|---|
| Entry Level (P10) | $45,900 | $22.07 |
| Lower Range (P25) | $51,745 | $24.88 |
| Median (P50)(typical) | $66,372 | $31.91 |
| Upper Range (P75) | $84,956 | $40.84 |
| Top Earners (P90) | $102,878 | $49.46 |
Median Salary Position
1.47% above the national average
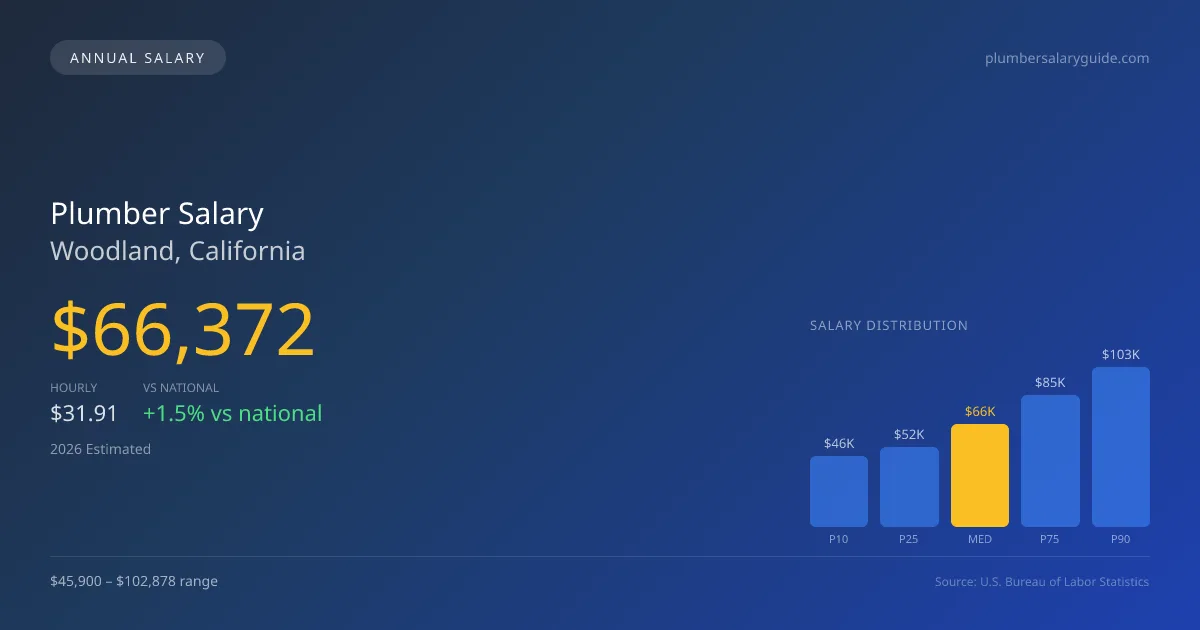
2026 Salary Percentile Distribution in Woodland
In Woodland, CA, the plumber salary spread from the 10th to 90th percentile is $56,978 (2026 est.). At $66,372, the local median is 1.47% above the national median of $65,408.
Salary Calculator
At 40 hours/week in Woodland: You'd be in the lower-middle range
How Woodland Plumber Pay Compares
Woodland median: $66,372/year (2026)
| Compared To | Median Salary | Woodland Pays |
|---|---|---|
| California Average | $65,521 | +1.30% more |
| National Average | $65,408 | +1.47% more |
Plumbers in Woodland, CA earn a median of $66,372 per year (2026 est.), which is 1.47% higher than the national median of $65,408 and 1.30% above the California state average of $65,521.
Cost-of-Living Adjusted Salary
Woodland has a cost of living 13.10% above the national average.
Adjusted salary = nominal × (100 / CoL index). CoL index: 100 = national average.
Woodland, CA has a cost-of-living index of 113.1 (above the national average of 100). While the nominal salary of $66,372 is competitive, the higher cost of living reduces purchasing power to an effective $58,684 — a 11.58% reduction.
Compare Purchasing Power
Select a city to see how your salary compares after cost of living
Select a city above to compare purchasing power
2019 BLS Actual
$55,974
2025 BLS Actual
$64,741
2026 Current Est.
$66,372
2019–2027 Growth
+21.6%
Salary Trajectory for Plumbers in Woodland (2019–2027)
2019–2025: actual BLS OEWS data for this metro area. 2026+: CAGR 2.52% projection.
| Year | Annual Salary | Status |
|---|---|---|
| 2019 | $55,974 | Actual |
| 2020 | $57,161 | Actual |
| 2021 | $60,763 | Actual |
| 2022 | $60,976 | Actual |
| 2023 | $62,458 | Actual |
| 2024 | $93,934 | Actual |
| 2025 | $64,741 | Actual |
| 2026(current) | $66,372 | Estimated |
| 2027 | $68,045 | Projected |
Based on 7 years of BLS OEWS data for the Woodland metropolitan area, the median plumber salary grew 15.7% from $55,974 (2019) to $64,741 (2025). At a 2.52% compound annual growth rate, salaries are projected to reach $68,045 by 2027 — a total increase of $12,071 (21.57%) from 2019.
Note: Historical values (2019–2025) are actual BLS OEWS figures for the Woodland metropolitan area, sourced from annual Occupational Employment and Wage Statistics surveys. 2026–2026 figures are current estimates, and 2027 values are projections, calculated using a 2.52% CAGR derived from 7-year BLS historical data. Actual salaries may vary based on employer, experience, certifications, and local market conditions.
Salary by Experience Level
| Experience | Estimated Salary Range |
|---|---|
| 0-2 years (New Graduate) | $45,900 – $51,745 |
| 3-5 years (Mid Career) | $51,745 – $66,372 |
| 5+ years (Experienced) | $66,372 – $84,956 |
| 10+ years (Top Earner) | $84,956 – $102,878 |
Plumber salary ranges estimated from BLS percentile data. Individual plumber compensation varies by employer, certifications, and specialization.
Plumber Job Market in Woodland
In Woodland, the employment landscape reveals 15 plumbers actively working in the area, a small but focused community where competition can affect earning potential. The cost-of-living index is 113.1, slightly above the national average, which necessitates strategically optimizing earnings to maintain purchasing power. Among various employers, union plumbing contractors often lead in compensation, providing pay that can exceed their non-union counterparts, while those specializing in medical gas installations or backflow prevention command higher wages due to their expertise. The disparity in salaries can stem from various factors, including specialty skill sets and commission-based income structures employed by larger service companies like Roto-Rooter and ARS. To maximize pay, plumbers in this market should consider obtaining advanced credentials, such as a master license or union membership, and seek opportunities in niche markets or high-demand sectors where they can leverage their skills for increased earnings.
More salary data for Woodland, CA:
Frequently Asked Questions
How much do plumbers make in Woodland, CA in 2026?
Is Woodland, CA a good place to work as a plumber?
Can plumbers make $100K in Woodland?
What is the cost-of-living adjusted plumber salary in Woodland?
How much does a plumber make per hour in Woodland?
Related Pages
Compare Salaries
Career Resources
Nearby Cities in California
Written by Samuel Torres, CWP
Career Analyst
Samuel Torres has 10 years of experience in plumbing. He specializes in residential plumbing systems. He has worked with several home improvement companies.
Methodology & Data Source
Salary figures on this page are 2026 projections based on the Bureau of Labor Statistics Occupational Employment and Wage Statistics (OEWS) survey, May 2026 release. The BLS reported a median annual salary of $64,741 for plumbersin the Woodland metropolitan area. A 2.52% compound annual growth rate (CAGR), calculated from 6-year national BLS wage trends, was applied to project current 2026 compensation. Percentile ranges (P10–P90) represent the full salary distribution across experience levels and practice settings in this market.
Data Sources & Methodology
Salary data for Woodland is estimated from official BLS state-level occupational wage data (2025), adjusted for regional cost-of-living differences using BEA RPP (Regional Price Parities).
2026 figures are projected from 2025 BLS data using a compound annual growth rate (CAGR) of 2.52%, derived from historical BLS wage trends for plumbers (SOC 47-2152).
Compiled and verified by Samuel Torres, CWP, a licensed plumber with 10+ years of clinical experience. · View source data at BLS.gov