Plumber Salary in Vacaville, CA: $65,394 (2026)
Quick Answer:A full-time plumber in Vacaville, CA earns a median $65,394/year (≈ $31.44/hour) in nominal terms for 2026 — projected from BLS OEWS 2025 (SOC 47-2152). Once you factor in Vacaville's price level (13% above national, BEA RPP 113.1), that paycheck buys what $57,820 would nationally. Nominal pay sits 0.2% below the California state average.
Based on BLS state-level estimates · View source
In 2026, the plumber salary in Vacaville, California, reflects a competitive landscape where the median annual income stands at $65,394. With a salary range extending from $45,937 at the 10th percentile to $101,362 at the 90th percentile, aspiring plumbers can find potential earnings contingent on their experience and specialization. Local estimates, derived from BLS state-level data and adjusted for regional cost variations, highlight how union pipefitter wages tend to dominate in this market, often surpassing their non-union counterparts by 30-50%. This pay gap not only attracts new entrants to the field but also shapes hiring trends, as skilled workers gravitate toward union opportunities that ensure higher compensation and benefits.
About the Vacaville Market
Salary estimated from California average ($82,000) adjusted for local cost of living.
Salary Breakdown
| Percentile | Annual | Hourly |
|---|---|---|
| Entry Level (P10) | $45,937 | $22.08 |
| Lower Range (P25) | $51,643 | $24.83 |
| Median (P50)(typical) | $65,394 | $31.44 |
| Upper Range (P75) | $83,705 | $40.24 |
| Top Earners (P90) | $101,362 | $48.73 |
Median Salary Position
0.02% below the national average
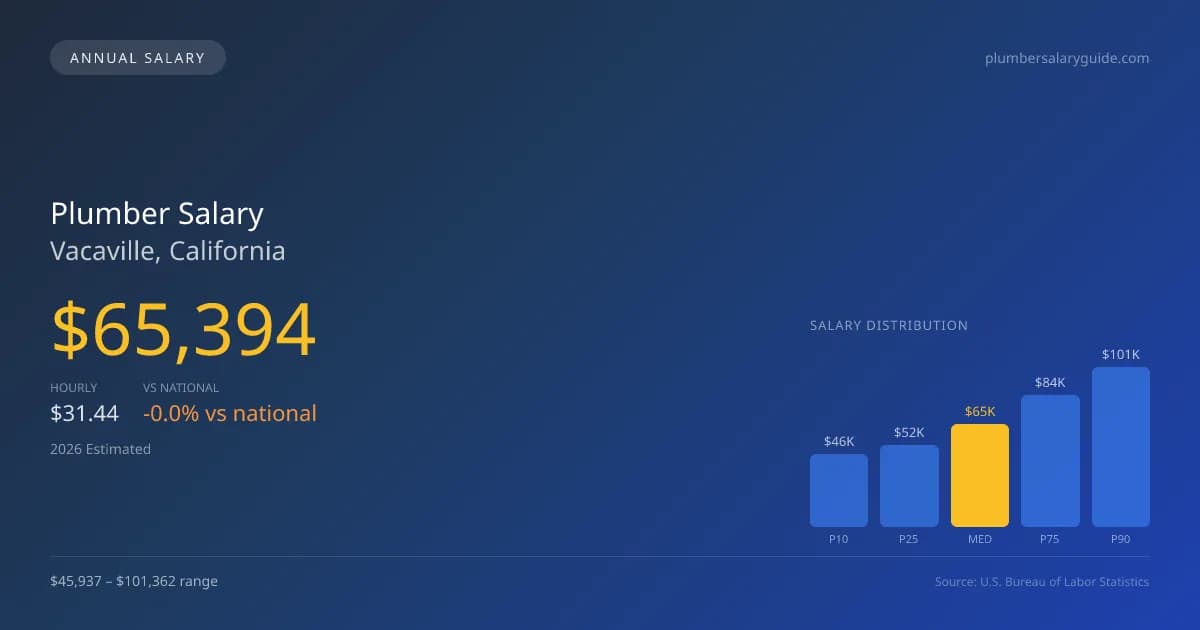
2026 Salary Percentile Distribution in Vacaville
In Vacaville, CA, the plumber salary spread from the 10th to 90th percentile is $55,425 (2026 est.). At $65,394, the local median is 0.02% below the national median of $65,408.
Salary Calculator
At 40 hours/week in Vacaville: You'd be in the lower-middle range
How Vacaville Plumber Pay Compares
Vacaville median: $65,394/year (2026)
| Compared To | Median Salary | Vacaville Pays |
|---|---|---|
| California Average | $65,525 | -0.20% less |
| National Average | $65,408 | -0.02% less |
Plumbers in Vacaville, CA earn a median of $65,394 per year (2026 est.), which is 0.02% lower than the national median of $65,408 and 0.20% below the California state average of $65,525.
Cost-of-Living Adjusted Salary
Vacaville has a cost of living 13.10% above the national average.
Adjusted salary = nominal × (100 / CoL index). CoL index: 100 = national average.
Vacaville, CA has a cost-of-living index of 113.1 (above the national average of 100). While the nominal salary of $65,394 is competitive, the higher cost of living reduces purchasing power to an effective $57,820 — a 11.58% reduction.
Compare Purchasing Power
Select a city to see how your salary compares after cost of living
Select a city above to compare purchasing power
2019 BLS Actual
$55,149
2025 BLS Actual
$63,787
2026 Current Est.
$65,394
2019–2027 Growth
+21.6%
Salary Trajectory for Plumbers in Vacaville (2019–2027)
2019–2025: actual BLS OEWS data for this metro area. 2026+: CAGR 2.52% projection.
| Year | Annual Salary | Status |
|---|---|---|
| 2019 | $55,149 | Actual |
| 2020 | $56,319 | Actual |
| 2021 | $59,868 | Actual |
| 2022 | $60,078 | Actual |
| 2023 | $61,537 | Actual |
| 2024 | $92,549 | Actual |
| 2025 | $63,787 | Actual |
| 2026(current) | $65,394 | Estimated |
| 2027 | $67,042 | Projected |
Based on 7 years of BLS OEWS data for the Vacaville metropolitan area, the median plumber salary grew 15.7% from $55,149 (2019) to $63,787 (2025). At a 2.52% compound annual growth rate, salaries are projected to reach $67,042 by 2027 — a total increase of $11,893 (21.57%) from 2019.
Note: Historical values (2019–2025) are actual BLS OEWS figures for the Vacaville metropolitan area, sourced from annual Occupational Employment and Wage Statistics surveys. 2026–2026 figures are current estimates, and 2027 values are projections, calculated using a 2.52% CAGR derived from 7-year BLS historical data. Actual salaries may vary based on employer, experience, certifications, and local market conditions.
Salary by Experience Level
| Experience | Estimated Salary Range |
|---|---|
| 0-2 years (New Graduate) | $45,937 – $51,643 |
| 3-5 years (Mid Career) | $51,643 – $65,394 |
| 5+ years (Experienced) | $65,394 – $83,705 |
| 10+ years (Top Earner) | $83,705 – $101,362 |
Plumber salary ranges estimated from BLS percentile data. Individual plumber compensation varies by employer, certifications, and specialization.
Plumber Job Market in Vacaville
In Vacaville, the job market for plumbers is relatively small but stable, with 15 professionals employed in the area. The cost of living index of 113.1 indicates a higher-than-average financial landscape, which impacts purchasing power. Particularly, union plumbing contractors affiliated with the UA (United Association) tend to offer the most competitive salaries, followed by self-employed plumbers and larger service companies. Factors influencing the disparity in pay include the nature of work—medical gas installation often commands higher rates due to its specialized skill set. Furthermore, successfully navigating the local market might involve obtaining additional certifications or specialties that increase demand; such as medical gas or backflow prevention credentials, which can be critical in elevating income potential. Adapting to the nuances of service vs. industrial plumbing also plays a significant role in enhancing earnings, making strategic career choices essential for long-term success.
More salary data for Vacaville, CA:
Frequently Asked Questions
How much do plumbers make in Vacaville, CA in 2026?
Is Vacaville, CA a good place to work as a plumber?
Can plumbers make $100K in Vacaville?
What is the cost-of-living adjusted plumber salary in Vacaville?
How much does a plumber make per hour in Vacaville?
Related Pages
Compare Salaries
Career Resources
Nearby Cities in California
Written by Samuel Torres, CWP
Career Analyst
Samuel Torres has 10 years of experience in plumbing. He specializes in residential plumbing systems. He has worked with several home improvement companies.
Methodology & Data Source
Salary figures on this page are 2026 projections based on the Bureau of Labor Statistics Occupational Employment and Wage Statistics (OEWS) survey, May 2026 release. The BLS reported a median annual salary of $63,787 for plumbersin the Vacaville metropolitan area. A 2.52% compound annual growth rate (CAGR), calculated from 6-year national BLS wage trends, was applied to project current 2026 compensation. Percentile ranges (P10–P90) represent the full salary distribution across experience levels and practice settings in this market.
Data Sources & Methodology
Salary data for Vacaville is estimated from official BLS state-level occupational wage data (2025), adjusted for regional cost-of-living differences using BEA RPP (Regional Price Parities).
2026 figures are projected from 2025 BLS data using a compound annual growth rate (CAGR) of 2.52%, derived from historical BLS wage trends for plumbers (SOC 47-2152).
Compiled and verified by Samuel Torres, CWP, a licensed plumber with 10+ years of clinical experience. · View source data at BLS.gov