Plumber Salary in Sunnyvale, CA: $112,860 (2026)
Quick Answer:A full-time plumber in Sunnyvale, CA earns a median $112,860/year (≈ $54.26/hour) in nominal terms for 2026 — projected from BLS OEWS 2025 (SOC 47-2152). Once you factor in Sunnyvale's price level (13% above national, BEA RPP 113.1), that paycheck buys what $99,788 would nationally. Nominal pay sits 72.2% above the California state average.
Based on BLS state-level estimates · View source
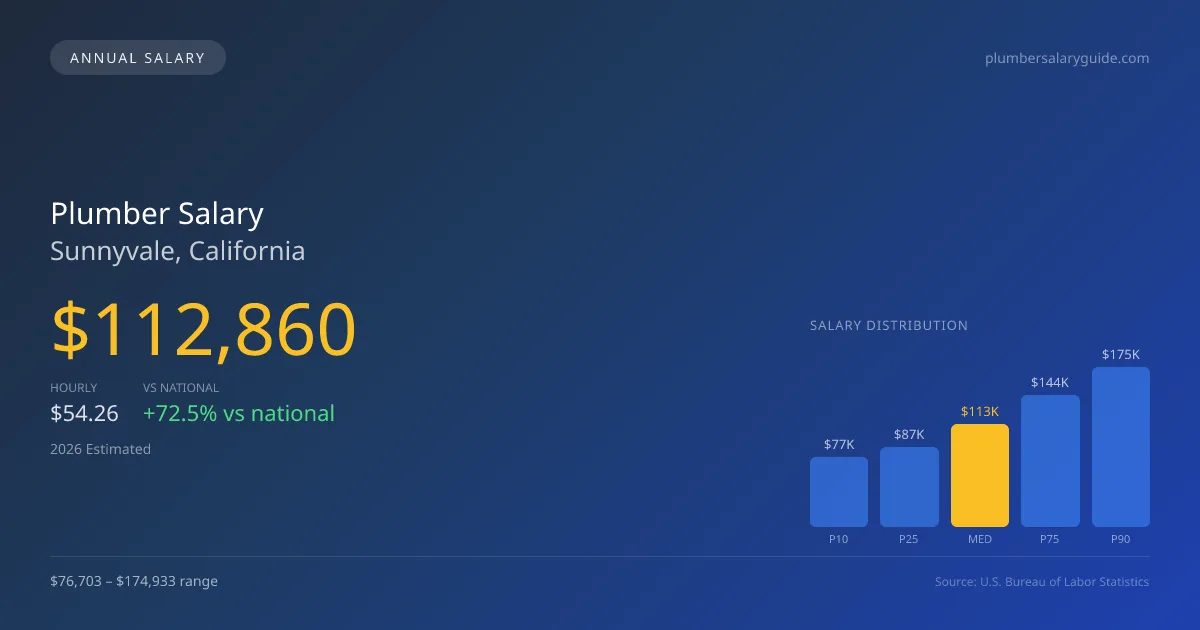
In Sunnyvale, California, the financial landscape for plumbers reflects significant earning potential, with a median annual salary forecasted at $112,860 in 2026. The salary spectrum spans from $76,703 at the P10 level to a noteworthy $174,933 at the P90 level. These figures represent local estimates based on 2025 BLS data projected to 2026, incorporating regional cost adjustments to supply a nuanced view of plumber pay in Sunnyvale CA. The dynamics of being a self-employed contractor often contrast sharply with the earnings of employed service plumbers, affecting job stability and income variability, ultimately shaping the contractor-versus-employee decision for many in this trade.
About the Sunnyvale Market
Salary estimated from California average ($82,000) adjusted for local cost of living.
Salary Breakdown
| Percentile | Annual | Hourly |
|---|---|---|
| Entry Level (P10) | $76,703 | $36.88 |
| Lower Range (P25) | $87,175 | $41.91 |
| Median (P50)(typical) | $112,860 | $54.26 |
| Upper Range (P75) | $144,461 | $69.46 |
| Top Earners (P90) | $174,933 | $84.11 |
Median Salary Position
72.55% above the national average
2026 Salary Percentile Distribution in Sunnyvale
In Sunnyvale, CA, the plumber salary spread from the 10th to 90th percentile is $98,230 (2026 est.). At $112,860, the local median is 72.55% above the national median of $65,408.
Salary Calculator
At 40 hours/week in Sunnyvale: You'd be in the lower-middle range
How Sunnyvale Plumber Pay Compares
Sunnyvale median: $112,860/year (2026)
| Compared To | Median Salary | Sunnyvale Pays |
|---|---|---|
| California Average | $65,540 | +72.20% more |
| National Average | $65,408 | +72.55% more |
Plumbers in Sunnyvale, CA earn a median of $112,860 per year (2026 est.), which is 72.55% higher than the national median of $65,408 and 72.20% above the California state average of $65,540.
Cost-of-Living Adjusted Salary
Sunnyvale has a cost of living 13.10% above the national average.
Adjusted salary = nominal × (100 / CoL index). CoL index: 100 = national average.
Sunnyvale, CA has a cost-of-living index of 113.1 (above the national average of 100). While the nominal salary of $112,860 is competitive, the higher cost of living reduces purchasing power to an effective $99,788 — a 11.58% reduction.
Compare Purchasing Power
Select a city to see how your salary compares after cost of living
Select a city above to compare purchasing power
2019 BLS Actual
$95,178
2025 BLS Actual
$110,086
2026 Current Est.
$112,860
2019–2027 Growth
+21.6%
Salary Trajectory for Plumbers in Sunnyvale (2019–2027)
2019–2025: actual BLS OEWS data for this metro area. 2026+: CAGR 2.52% projection.
| Year | Annual Salary | Status |
|---|---|---|
| 2019 | $95,178 | Actual |
| 2020 | $97,197 | Actual |
| 2021 | $103,322 | Actual |
| 2022 | $103,684 | Actual |
| 2023 | $106,204 | Actual |
| 2024 | $95,869 | Actual |
| 2025 | $110,086 | Actual |
| 2026(current) | $112,860 | Estimated |
| 2027 | $115,704 | Projected |
Based on 7 years of BLS OEWS data for the Sunnyvale metropolitan area, the median plumber salary grew 15.7% from $95,178 (2019) to $110,086 (2025). At a 2.52% compound annual growth rate, salaries are projected to reach $115,704 by 2027 — a total increase of $20,526 (21.57%) from 2019.
Note: Historical values (2019–2025) are actual BLS OEWS figures for the Sunnyvale metropolitan area, sourced from annual Occupational Employment and Wage Statistics surveys. 2026–2026 figures are current estimates, and 2027 values are projections, calculated using a 2.52% CAGR derived from 7-year BLS historical data. Actual salaries may vary based on employer, experience, certifications, and local market conditions.
Salary by Experience Level
| Experience | Estimated Salary Range |
|---|---|
| 0-2 years (New Graduate) | $76,703 – $87,175 |
| 3-5 years (Mid Career) | $87,175 – $112,860 |
| 5+ years (Experienced) | $112,860 – $144,461 |
| 10+ years (Top Earner) | $144,461 – $174,933 |
Plumber salary ranges estimated from BLS percentile data. Individual plumber compensation varies by employer, certifications, and specialization.
Plumber Job Market in Sunnyvale
The job market for plumbers in Sunnyvale shows solid demand, with 26 plumbers currently employed in the area. However, the cost of living index stands at 113.1, indicating a higher-than-average cost of living that can impact overall take-home purchasing power. Among the employers, union plumbing contractors, particularly those affiliated with the United Association, typically offer higher pay due to union-negotiated agreements, which are often 30-50% greater than non-union rates. Specialty skills, such as medical gas installation or backflow prevention, also command premiums and can significantly differentiate earnings in this competitive environment. To maximize earnings in this market, plumbers may benefit from pursuing advanced certifications, gaining experience in high-demand specialties, or exploring opportunities with larger service companies where commission structures can enhance total pay.
More salary data for Sunnyvale, CA:
Frequently Asked Questions
How much do plumbers make in Sunnyvale, CA in 2026?
Is Sunnyvale, CA a good place to work as a plumber?
Can plumbers make $100K in Sunnyvale?
What is the cost-of-living adjusted plumber salary in Sunnyvale?
How much does a plumber make per hour in Sunnyvale?
Related Pages
Compare Salaries
Career Resources
Nearby Cities in California
Written by Samuel Torres, CWP
Career Analyst
Samuel Torres has 10 years of experience in plumbing. He specializes in residential plumbing systems. He has worked with several home improvement companies.
Methodology & Data Source
Salary figures on this page are 2026 projections based on the Bureau of Labor Statistics Occupational Employment and Wage Statistics (OEWS) survey, May 2026 release. The BLS reported a median annual salary of $110,086 for plumbersin the Sunnyvale metropolitan area. A 2.52% compound annual growth rate (CAGR), calculated from 6-year national BLS wage trends, was applied to project current 2026 compensation. Percentile ranges (P10–P90) represent the full salary distribution across experience levels and practice settings in this market.
Data Sources & Methodology
Salary data for Sunnyvale is estimated from official BLS state-level occupational wage data (2025), adjusted for regional cost-of-living differences using BEA RPP (Regional Price Parities).
2026 figures are projected from 2025 BLS data using a compound annual growth rate (CAGR) of 2.52%, derived from historical BLS wage trends for plumbers (SOC 47-2152).
Compiled and verified by Samuel Torres, CWP, a licensed plumber with 10+ years of clinical experience. · View source data at BLS.gov