Plumber Salary in Santa Maria, CA: $62,537 (2026)
Quick Answer:A full-time plumber in Santa Maria, CA earns a median $62,537/year (≈ $30.07/hour) in nominal terms for 2026 — projected from BLS OEWS 2025 (SOC 47-2152). Once you factor in Santa Maria's price level (9% above national, BEA RPP 108.8), that paycheck buys what $57,480 would nationally. Nominal pay sits 4.6% below the California state average.
Official BLS data · View source
In Santa Maria, California, the projected median annual salary for plumbers in 2026 is set at $62,537. This figure positions the local plumber pay below the national median of $65,408, highlighting a unique economic landscape for tradespeople in the region. Salaries for plumbers in Santa Maria fall within a range that spans from $55,443 at the 10th percentile to $113,705 at the 90th percentile. This data, derived from 2025 BLS OEWS surveys, sheds light on the earnings potential of plumbers, particularly as self-employed contractors versus those employed by service companies. With a growing demand for skilled professionals in the plumbing trade driven by aging infrastructure and a dwindling workforce, Santa Maria's job market shows promise for plumbers seeking steady employment or lucrative self-employment opportunities.
Salary Breakdown
| Percentile | Annual | Hourly |
|---|---|---|
| Entry Level (P10) | $55,443 | $26.66 |
| Lower Range (P25) | $57,811 | $27.79 |
| Median (P50)(typical) | $62,537 | $30.07 |
| Upper Range (P75) | $81,391 | $39.13 |
| Top Earners (P90) | $113,705 | $54.66 |
Median Salary Position
4.39% below the national average
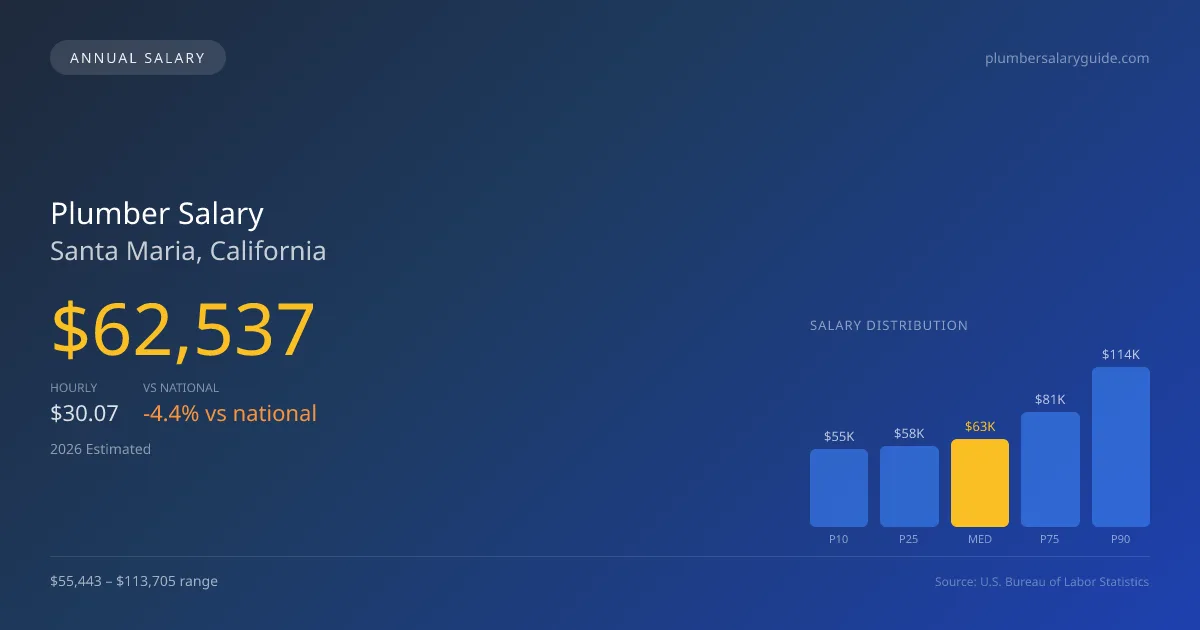
2026 Salary Percentile Distribution in Santa Maria
In Santa Maria, CA, the plumber salary spread from the 10th to 90th percentile is $58,262 (2026 est.). At $62,537, the local median is 4.39% below the national median of $65,408.
Salary Calculator
At 40 hours/week in Santa Maria: You'd be in the entry-level range
How Santa Maria Plumber Pay Compares
Santa Maria median: $62,537/year (2026)
| Compared To | Median Salary | Santa Maria Pays |
|---|---|---|
| California Average | $65,553 | -4.60% less |
| National Average | $65,408 | -4.39% less |
Plumbers in Santa Maria, CA earn a median of $62,537 per year (2026 est.), which is 4.39% lower than the national median of $65,408 and 4.60% below the California state average of $65,553.
Cost-of-Living Adjusted Salary
Santa Maria has a cost of living 8.80% above the national average.
Adjusted salary = nominal × (100 / CoL index). CoL index: 100 = national average.
Santa Maria, CA has a cost-of-living index of 108.798 (above the national average of 100). While the nominal salary of $62,537 is competitive, the higher cost of living reduces purchasing power to an effective $57,480 — a 8.09% reduction.
Compare Purchasing Power
Select a city to see how your salary compares after cost of living
Select a city above to compare purchasing power
2019 BLS Actual
$62,130
2025 BLS Actual
$61,000
2026 Current Est.
$62,537
2019–2027 Growth
+3.2%
Salary Trajectory for Plumbers in Santa Maria (2019–2027)
2019–2025: actual BLS OEWS data for this metro area. 2026+: CAGR 2.52% projection.
| Year | Annual Salary | Status |
|---|---|---|
| 2019 | $62,130 | Actual |
| 2020 | $68,310 | Actual |
| 2021 | $61,550 | Actual |
| 2022 | $59,750 | Actual |
| 2023 | $60,720 | Actual |
| 2024 | $60,790 | Actual |
| 2025 | $61,000 | Actual |
| 2026(current) | $62,537 | Estimated |
| 2027 | $64,113 | Projected |
Based on 7 years of BLS OEWS data for the Santa Maria metropolitan area, the median plumber salary grew -1.8% from $62,130 (2019) to $61,000 (2025). At a 2.52% compound annual growth rate, salaries are projected to reach $64,113 by 2027 — a total increase of $1,983 (3.19%) from 2019.
Note: Historical values (2019–2025) are actual BLS OEWS figures for the Santa Maria metropolitan area, sourced from annual Occupational Employment and Wage Statistics surveys. 2026–2026 figures are current estimates, and 2027 values are projections, calculated using a 2.52% CAGR derived from 7-year BLS historical data. Actual salaries may vary based on employer, experience, certifications, and local market conditions.
Salary by Experience Level
| Experience | Estimated Salary Range |
|---|---|
| 0-2 years (New Graduate) | $55,443 – $57,811 |
| 3-5 years (Mid Career) | $57,811 – $62,537 |
| 5+ years (Experienced) | $62,537 – $81,391 |
| 10+ years (Top Earner) | $81,391 – $113,705 |
Plumber salary ranges estimated from BLS percentile data. Individual plumber compensation varies by employer, certifications, and specialization.
Plumber Job Market in Santa Maria
The plumbing job market in Santa Maria currently employs around 740 professionals, contributing to a competitive local economy. With a cost of living index of 108.798, plumbers must strategically consider their salary against local expenses. Employers that tend to pay the highest salaries include union plumbing contractors affiliated with the United Association, along with industrial maintenance teams and government water utilities. The disparity in earnings often stems from variations in company type—union wages can command a significant premium, while commission-driven roles at large service companies like Roto-Rooter can offer variable but potentially lucrative pay. Aspiring plumbers aiming to maximize their earnings might consider pursuing specialty credentials in medical gas or backflow prevention, as well as obtaining a master or contractor license to enhance their marketability. Overall, understanding the local economic drivers and taking advantage of specialized skills can significantly improve a plumber's pay in Santa Maria, CA.
More salary data for Santa Maria, CA:
Frequently Asked Questions
How much do plumbers make in Santa Maria, CA in 2026?
Is Santa Maria, CA a good place to work as a plumber?
Can plumbers make $100K in Santa Maria?
What is the cost-of-living adjusted plumber salary in Santa Maria?
How much does a plumber make per hour in Santa Maria?
Related Pages
Compare Salaries
Career Resources
Nearby Cities in California
Written by Samuel Torres, CWP
Career Analyst
Samuel Torres has 10 years of experience in plumbing. He specializes in residential plumbing systems. He has worked with several home improvement companies.
Methodology & Data Source
Salary figures on this page are 2026 projections based on the Bureau of Labor Statistics Occupational Employment and Wage Statistics (OEWS) survey, May 2026 release. The BLS reported a median annual salary of $61,000 for plumbersin the Santa Maria metropolitan area. A 2.52% compound annual growth rate (CAGR), calculated from 6-year national BLS wage trends, was applied to project current 2026 compensation. Percentile ranges (P10–P90) represent the full salary distribution across experience levels and practice settings in this market.
Data Sources & Methodology
Source: BLS, OEWS, 7-year dataset (–). Per-city data from annual BLS metropolitan area surveys.
2026 figures are projected from 2025 BLS data using a compound annual growth rate (CAGR) of 2.52%, derived from historical BLS wage trends for plumbers (SOC 47-2152).
Compiled and verified by Samuel Torres, CWP, a licensed plumber with 10+ years of clinical experience. · View source data at BLS.gov