Plumber Salary in San Ramon, CA: $65,459 (2026)
Quick Answer:A full-time plumber in San Ramon, CA earns a median $65,459/year (≈ $31.47/hour) in nominal terms for 2026 — projected from BLS OEWS 2025 (SOC 47-2152). Once you factor in San Ramon's price level (13% above national, BEA RPP 113.1), that paycheck buys what $57,877 would nationally. Nominal pay sits 0.1% below the California state average.
Based on BLS state-level estimates · View source
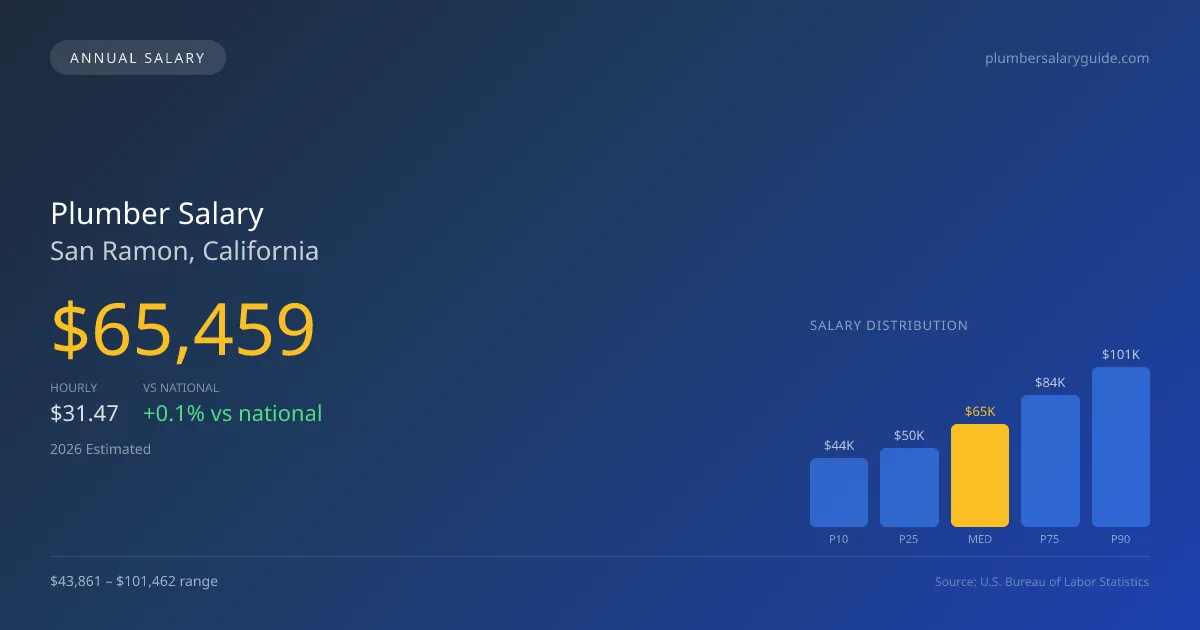
In 2026, plumbers in San Ramon, CA, are projected to earn a median annual salary of $65,459, placing this figure slightly above the national median of $65,408. The salary range in this locale extends from $43,861 at the 10th percentile to $101,462 for the 90th percentile, reflecting a significant disparity in earnings among plumbing professionals. Estimates derived from BLS state-level data and adjusted for regional price parities indicate that union pipefitters typically command a substantial pay premium, often earning 30-50% more than their non-union counterparts. The competitive nature of the job market here is influenced by the demand for skilled trades in San Ramon, particularly given the city’s growing infrastructure needs and an aging workforce.
About the San Ramon Market
Salary estimated from California average ($82,000) adjusted for local cost of living.
Salary Breakdown
| Percentile | Annual | Hourly |
|---|---|---|
| Entry Level (P10) | $43,861 | $21.09 |
| Lower Range (P25) | $49,927 | $24.00 |
| Median (P50)(typical) | $65,459 | $31.47 |
| Upper Range (P75) | $83,788 | $40.28 |
| Top Earners (P90) | $101,462 | $48.78 |
Median Salary Position
0.08% above the national average
2026 Salary Percentile Distribution in San Ramon
In San Ramon, CA, the plumber salary spread from the 10th to 90th percentile is $57,601 (2026 est.). At $65,459, the local median is 0.08% above the national median of $65,408.
Salary Calculator
At 40 hours/week in San Ramon: You'd be in the lower-middle range
How San Ramon Plumber Pay Compares
San Ramon median: $65,459/year (2026)
| Compared To | Median Salary | San Ramon Pays |
|---|---|---|
| California Average | $65,525 | -0.10% less |
| National Average | $65,408 | +0.08% more |
Plumbers in San Ramon, CA earn a median of $65,459 per year (2026 est.), which is 0.08% higher than the national median of $65,408 and 0.10% below the California state average of $65,525.
Cost-of-Living Adjusted Salary
San Ramon has a cost of living 13.10% above the national average.
Adjusted salary = nominal × (100 / CoL index). CoL index: 100 = national average.
San Ramon, CA has a cost-of-living index of 113.1 (above the national average of 100). While the nominal salary of $65,459 is competitive, the higher cost of living reduces purchasing power to an effective $57,877 — a 11.58% reduction.
Compare Purchasing Power
Select a city to see how your salary compares after cost of living
Select a city above to compare purchasing power
2019 BLS Actual
$55,203
2025 BLS Actual
$63,850
2026 Current Est.
$65,459
2019–2027 Growth
+21.6%
Salary Trajectory for Plumbers in San Ramon (2019–2027)
2019–2025: actual BLS OEWS data for this metro area. 2026+: CAGR 2.52% projection.
| Year | Annual Salary | Status |
|---|---|---|
| 2019 | $55,203 | Actual |
| 2020 | $56,374 | Actual |
| 2021 | $59,927 | Actual |
| 2022 | $60,137 | Actual |
| 2023 | $61,598 | Actual |
| 2024 | $92,641 | Actual |
| 2025 | $63,850 | Actual |
| 2026(current) | $65,459 | Estimated |
| 2027 | $67,109 | Projected |
Based on 7 years of BLS OEWS data for the San Ramon metropolitan area, the median plumber salary grew 15.7% from $55,203 (2019) to $63,850 (2025). At a 2.52% compound annual growth rate, salaries are projected to reach $67,109 by 2027 — a total increase of $11,906 (21.57%) from 2019.
Note: Historical values (2019–2025) are actual BLS OEWS figures for the San Ramon metropolitan area, sourced from annual Occupational Employment and Wage Statistics surveys. 2026–2026 figures are current estimates, and 2027 values are projections, calculated using a 2.52% CAGR derived from 7-year BLS historical data. Actual salaries may vary based on employer, experience, certifications, and local market conditions.
Salary by Experience Level
| Experience | Estimated Salary Range |
|---|---|
| 0-2 years (New Graduate) | $43,861 – $49,927 |
| 3-5 years (Mid Career) | $49,927 – $65,459 |
| 5+ years (Experienced) | $65,459 – $83,788 |
| 10+ years (Top Earner) | $83,788 – $101,462 |
Plumber salary ranges estimated from BLS percentile data. Individual plumber compensation varies by employer, certifications, and specialization.
Plumber Job Market in San Ramon
With only 19 plumbers currently employed locally, the job market is relatively small, which might intensify competition among those seeking higher wages. The cost of living index in San Ramon stands at 113.1, indicating that expenses are above the national average, which necessitates careful financial planning for take-home purchasing power. Employers that typically offer the highest compensation include union plumbing contractors affiliated with the United Association, as well as specialized positions in medical gas or industrial maintenance, where skill level and niche expertise command higher pay. To maximize potential earnings, plumbers should consider obtaining specialty certifications, participating in unions, or branching into self-employment where margins can be more favorable, despite potential income variability. Emphasizing advanced skills and certifications, especially in high-demand areas, can significantly enhance the plumber pay landscape in San Ramon.
More salary data for San Ramon, CA:
Frequently Asked Questions
How much do plumbers make in San Ramon, CA in 2026?
Is San Ramon, CA a good place to work as a plumber?
Can plumbers make $100K in San Ramon?
What is the cost-of-living adjusted plumber salary in San Ramon?
How much does a plumber make per hour in San Ramon?
Related Pages
Compare Salaries
Career Resources
Nearby Cities in California
Written by Samuel Torres, CWP
Career Analyst
Samuel Torres has 10 years of experience in plumbing. He specializes in residential plumbing systems. He has worked with several home improvement companies.
Methodology & Data Source
Salary figures on this page are 2026 projections based on the Bureau of Labor Statistics Occupational Employment and Wage Statistics (OEWS) survey, May 2026 release. The BLS reported a median annual salary of $63,850 for plumbersin the San Ramon metropolitan area. A 2.52% compound annual growth rate (CAGR), calculated from 6-year national BLS wage trends, was applied to project current 2026 compensation. Percentile ranges (P10–P90) represent the full salary distribution across experience levels and practice settings in this market.
Data Sources & Methodology
Salary data for San Ramon is estimated from official BLS state-level occupational wage data (2025), adjusted for regional cost-of-living differences using BEA RPP (Regional Price Parities).
2026 figures are projected from 2025 BLS data using a compound annual growth rate (CAGR) of 2.52%, derived from historical BLS wage trends for plumbers (SOC 47-2152).
Compiled and verified by Samuel Torres, CWP, a licensed plumber with 10+ years of clinical experience. · View source data at BLS.gov