Plumber Salary in San Marcos, CA: $65,522 (2026)
Quick Answer:A full-time plumber in San Marcos, CA earns a median $65,522/year (≈ $31.50/hour) in nominal terms for 2026 — projected from BLS OEWS 2025 (SOC 47-2152). Once you factor in San Marcos's price level (13% above national, BEA RPP 113.1), that paycheck buys what $57,933 would nationally. Nominal pay sits 0.0% above the California state average.
Based on BLS state-level estimates · View source
In 2026, the plumber salary in San Marcos, CA, is projected to reach a median annual income of $65,522, slightly higher than the national average of $65,408. Local salaries range broadly from $43,735 at the 10th percentile to $101,558 at the 90th percentile, indicating significant earning potential for skilled professionals in this field. These estimates, derived from 2025 BLS data and adjusted for local living costs, reflect the trade-off between employed positions and self-employed contracting. Amidst a community where 17 plumbers are currently employed, the job market in San Marcos shows promise for those who select their career paths wisely, particularly as demand continues due to infrastructure needs and an aging workforce.
About the San Marcos Market
Salary estimated from California average ($82,000) adjusted for local cost of living.
Salary Breakdown
| Percentile | Annual | Hourly |
|---|---|---|
| Entry Level (P10) | $43,735 | $21.03 |
| Lower Range (P25) | $50,050 | $24.06 |
| Median (P50)(typical) | $65,522 | $31.50 |
| Upper Range (P75) | $83,868 | $40.32 |
| Top Earners (P90) | $101,558 | $48.83 |
Median Salary Position
0.17% above the national average
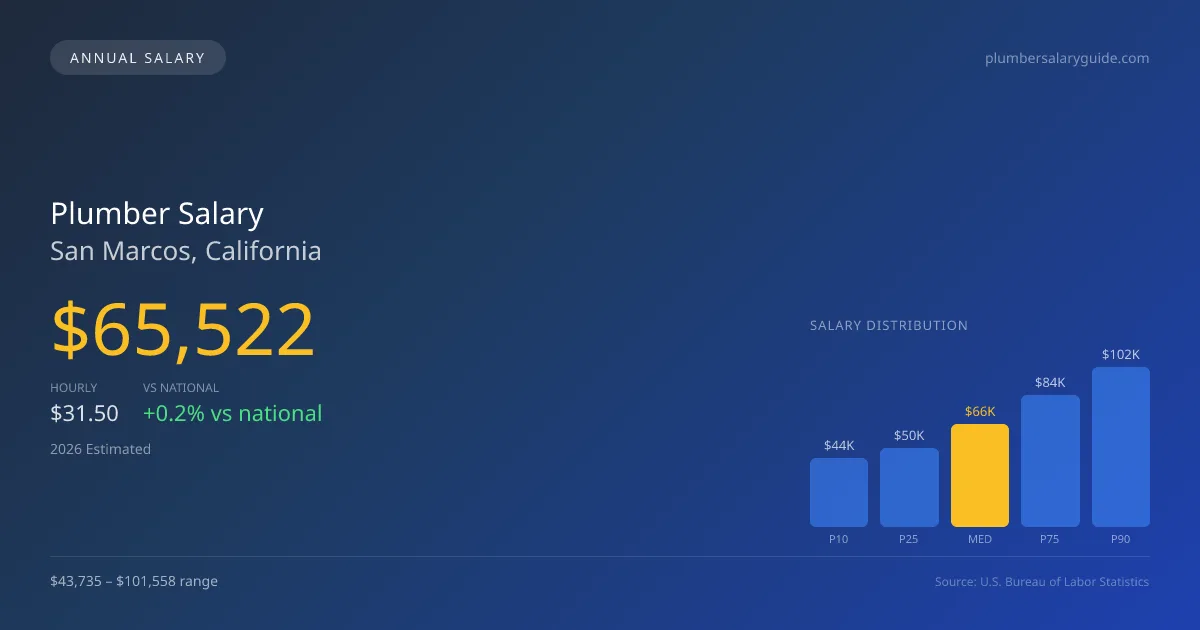
2026 Salary Percentile Distribution in San Marcos
In San Marcos, CA, the plumber salary spread from the 10th to 90th percentile is $57,823 (2026 est.). At $65,522, the local median is 0.17% above the national median of $65,408.
Salary Calculator
At 40 hours/week in San Marcos: You'd be in the lower-middle range
How San Marcos Plumber Pay Compares
San Marcos median: $65,522/year (2026)
| Compared To | Median Salary | San Marcos Pays |
|---|---|---|
| National Average | $65,408 | +0.17% more |
Plumbers in San Marcos, CA earn a median of $65,522 per year (2026 est.), which is 0.17% higher than the national median of $65,408.
Cost-of-Living Adjusted Salary
San Marcos has a cost of living 13.10% above the national average.
Adjusted salary = nominal × (100 / CoL index). CoL index: 100 = national average.
San Marcos, CA has a cost-of-living index of 113.1 (above the national average of 100). While the nominal salary of $65,522 is competitive, the higher cost of living reduces purchasing power to an effective $57,933 — a 11.58% reduction.
Compare Purchasing Power
Select a city to see how your salary compares after cost of living
Select a city above to compare purchasing power
2019 BLS Actual
$55,256
2025 BLS Actual
$63,911
2026 Current Est.
$65,522
2019–2027 Growth
+21.6%
Salary Trajectory for Plumbers in San Marcos (2019–2027)
2019–2025: actual BLS OEWS data for this metro area. 2026+: CAGR 2.52% projection.
| Year | Annual Salary | Status |
|---|---|---|
| 2019 | $55,256 | Actual |
| 2020 | $56,428 | Actual |
| 2021 | $59,984 | Actual |
| 2022 | $60,195 | Actual |
| 2023 | $61,657 | Actual |
| 2024 | $92,729 | Actual |
| 2025 | $63,911 | Actual |
| 2026(current) | $65,522 | Estimated |
| 2027 | $67,173 | Projected |
Based on 7 years of BLS OEWS data for the San Marcos metropolitan area, the median plumber salary grew 15.7% from $55,256 (2019) to $63,911 (2025). At a 2.52% compound annual growth rate, salaries are projected to reach $67,173 by 2027 — a total increase of $11,917 (21.57%) from 2019.
Note: Historical values (2019–2025) are actual BLS OEWS figures for the San Marcos metropolitan area, sourced from annual Occupational Employment and Wage Statistics surveys. 2026–2026 figures are current estimates, and 2027 values are projections, calculated using a 2.52% CAGR derived from 7-year BLS historical data. Actual salaries may vary based on employer, experience, certifications, and local market conditions.
Salary by Experience Level
| Experience | Estimated Salary Range |
|---|---|
| 0-2 years (New Graduate) | $43,735 – $50,050 |
| 3-5 years (Mid Career) | $50,050 – $65,522 |
| 5+ years (Experienced) | $65,522 – $83,868 |
| 10+ years (Top Earner) | $83,868 – $101,558 |
Plumber salary ranges estimated from BLS percentile data. Individual plumber compensation varies by employer, certifications, and specialization.
Plumber Job Market in San Marcos
The cost of living index in San Marcos stands at 113.1, which suggests that while salaries may offer competitive pay, take-home purchasing power could be affected by higher living expenses. Among plumbing employers in the area, union positions, particularly with UA signatories, tend to offer higher wages compared to non-union or open-shop contractors, especially in specialized fields such as medical gas installation or industrial plumbing. With the right credentials—such as a master license or specialized training—plumbers can enhance their earning potential. The variation in pay reflects differences in employment type, with self-employed plumbers often dealing with fluctuating incomes based on project availability and market rates. For those seeking to maximize plumber pay in San Marcos, focusing on gaining additional qualifications and aligning with reputable plumbing companies can provide significant advantages.
More salary data for San Marcos, CA:
Frequently Asked Questions
How much do plumbers make in San Marcos, CA in 2026?
Is San Marcos, CA a good place to work as a plumber?
Can plumbers make $100K in San Marcos?
What is the cost-of-living adjusted plumber salary in San Marcos?
How much does a plumber make per hour in San Marcos?
Related Pages
Compare Salaries
Career Resources
Nearby Cities in California
Written by Samuel Torres, CWP
Career Analyst
Samuel Torres has 10 years of experience in plumbing. He specializes in residential plumbing systems. He has worked with several home improvement companies.
Methodology & Data Source
Salary figures on this page are 2026 projections based on the Bureau of Labor Statistics Occupational Employment and Wage Statistics (OEWS) survey, May 2026 release. The BLS reported a median annual salary of $63,911 for plumbersin the San Marcos metropolitan area. A 2.52% compound annual growth rate (CAGR), calculated from 6-year national BLS wage trends, was applied to project current 2026 compensation. Percentile ranges (P10–P90) represent the full salary distribution across experience levels and practice settings in this market.
Data Sources & Methodology
Salary data for San Marcos is estimated from official BLS state-level occupational wage data (2025), adjusted for regional cost-of-living differences using BEA RPP (Regional Price Parities).
2026 figures are projected from 2025 BLS data using a compound annual growth rate (CAGR) of 2.52%, derived from historical BLS wage trends for plumbers (SOC 47-2152).
Compiled and verified by Samuel Torres, CWP, a licensed plumber with 10+ years of clinical experience. · View source data at BLS.gov