Plumber Salary in San Luis Obispo, CA: $64,680 (2026)
Quick Answer:A full-time plumber in San Luis Obispo, CA earns a median $64,680/year (≈ $31.09/hour) in nominal terms for 2026 — projected from BLS OEWS 2025 (SOC 47-2152). Once you factor in San Luis Obispo's price level (9% above national, BEA RPP 108.6), that paycheck buys what $59,560 would nationally. Nominal pay sits 1.3% below the California state average.
Official BLS data · View source
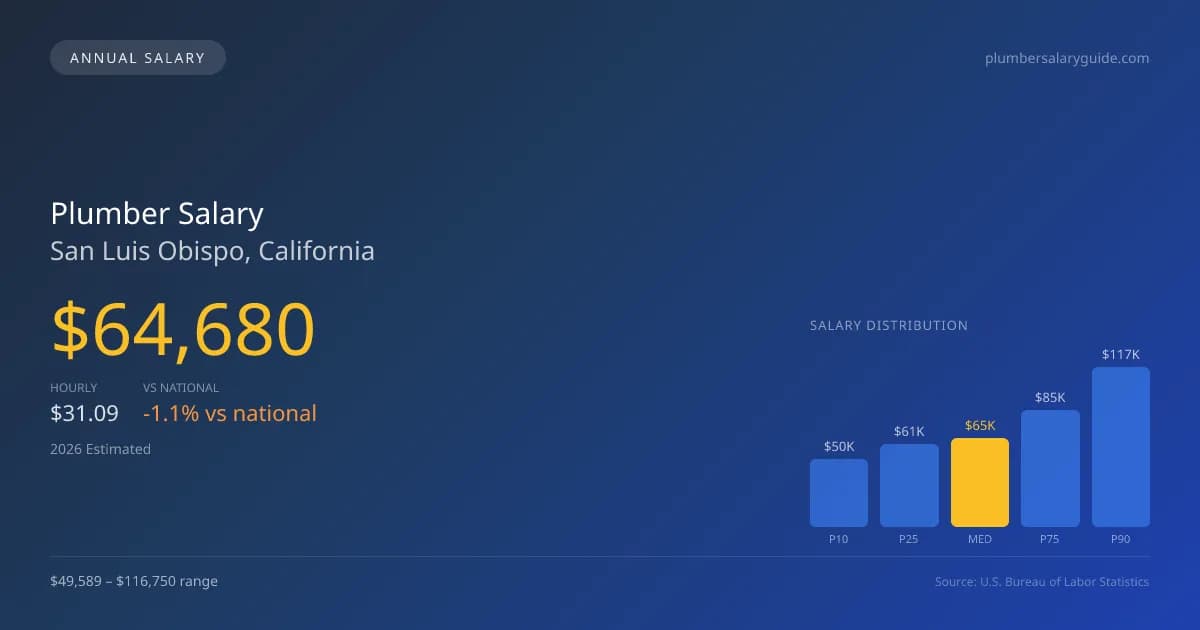
In 2026, the plumber salary in San Luis Obispo is projected to reach a median of $64,680, slightly below the national average of $65,408. The salary range for plumbers in this area is quite broad, spanning from $49,589 at the 10th percentile to $116,750 at the 90th percentile, highlighting the potential for significant income based on experience and specialization. This data comes from 2025 BLS data, projected to 2026, reflecting strong demand for skilled professionals, particularly in fields such as medical gas piping and underground utility installation. As the market continues to grow, those plumbers who specialize may find themselves earning higher premiums, positioning themselves well within the San Luis Obispo job market.
Salary Breakdown
| Percentile | Annual | Hourly |
|---|---|---|
| Entry Level (P10) | $49,589 | $23.84 |
| Lower Range (P25) | $60,528 | $29.10 |
| Median (P50)(typical) | $64,680 | $31.09 |
| Upper Range (P75) | $85,184 | $40.96 |
| Top Earners (P90) | $116,750 | $56.13 |
Median Salary Position
1.11% below the national average
2026 Salary Percentile Distribution in San Luis Obispo
In San Luis Obispo, CA, the plumber salary spread from the 10th to 90th percentile is $67,161 (2026 est.). At $64,680, the local median is 1.11% below the national median of $65,408.
Salary Calculator
At 40 hours/week in San Luis Obispo: You'd be in the entry-level range
How San Luis Obispo Plumber Pay Compares
San Luis Obispo median: $64,680/year (2026)
| Compared To | Median Salary | San Luis Obispo Pays |
|---|---|---|
| California Average | $65,532 | -1.30% less |
| National Average | $65,408 | -1.11% less |
Plumbers in San Luis Obispo, CA earn a median of $64,680 per year (2026 est.), which is 1.11% lower than the national median of $65,408 and 1.30% below the California state average of $65,532.
Cost-of-Living Adjusted Salary
San Luis Obispo has a cost of living 8.60% above the national average.
Adjusted salary = nominal × (100 / CoL index). CoL index: 100 = national average.
San Luis Obispo, CA has a cost-of-living index of 108.596 (above the national average of 100). While the nominal salary of $64,680 is competitive, the higher cost of living reduces purchasing power to an effective $59,560 — a 7.92% reduction.
Compare Purchasing Power
Select a city to see how your salary compares after cost of living
Select a city above to compare purchasing power
2019 BLS Actual
$53,040
2025 BLS Actual
$63,090
2026 Current Est.
$64,680
2019–2027 Growth
+25.0%
Salary Trajectory for Plumbers in San Luis Obispo (2019–2027)
2019–2025: actual BLS OEWS data for this metro area. 2026+: CAGR 2.52% projection.
| Year | Annual Salary | Status |
|---|---|---|
| 2019 | $53,040 | Actual |
| 2020 | $59,000 | Actual |
| 2021 | $60,360 | Actual |
| 2022 | $62,420 | Actual |
| 2023 | $61,040 | Actual |
| 2024 | $61,990 | Actual |
| 2025 | $63,090 | Actual |
| 2026(current) | $64,680 | Estimated |
| 2027 | $66,310 | Projected |
Based on 7 years of BLS OEWS data for the San Luis Obispo metropolitan area, the median plumber salary grew 18.9% from $53,040 (2019) to $63,090 (2025). At a 2.52% compound annual growth rate, salaries are projected to reach $66,310 by 2027 — a total increase of $13,270 (25.02%) from 2019.
Note: Historical values (2019–2025) are actual BLS OEWS figures for the San Luis Obispo metropolitan area, sourced from annual Occupational Employment and Wage Statistics surveys. 2026–2026 figures are current estimates, and 2027 values are projections, calculated using a 2.52% CAGR derived from 7-year BLS historical data. Actual salaries may vary based on employer, experience, certifications, and local market conditions.
Salary by Experience Level
| Experience | Estimated Salary Range |
|---|---|
| 0-2 years (New Graduate) | $49,589 – $60,528 |
| 3-5 years (Mid Career) | $60,528 – $64,680 |
| 5+ years (Experienced) | $64,680 – $85,184 |
| 10+ years (Top Earner) | $85,184 – $116,750 |
Plumber salary ranges estimated from BLS percentile data. Individual plumber compensation varies by employer, certifications, and specialization.
Plumber Job Market in San Luis Obispo
San Luis Obispo has approximately 320 plumbers employed, a number that illustrates the local job market's stability amidst an ever-increasing cost of living index of 108.596, indicating that expenses in the area are above the national average. For plumbers seeking higher compensation, union contractors represented by the United Association tend to offer better pay than their non-union counterparts. Those involved in industrial maintenance or specialized service jobs can also command higher earnings. The pay disparity within the sector often stems from varying experience levels, specialty endorsements, and the type of employment arrangements—self-employed plumbers might enjoy greater income flexibility but face unpredictable financial ebbs and flows. For those aiming to maximize their plumber pay in San Luis Obispo, pursuing advanced credentials in specialties like medical gas installation or seeking employment with high-paying companies can be effective strategies.
More salary data for San Luis Obispo, CA:
Frequently Asked Questions
How much do plumbers make in San Luis Obispo, CA in 2026?
Is San Luis Obispo, CA a good place to work as a plumber?
Can plumbers make $100K in San Luis Obispo?
What is the cost-of-living adjusted plumber salary in San Luis Obispo?
How much does a plumber make per hour in San Luis Obispo?
Related Pages
Compare Salaries
Career Resources
Nearby Cities in California
Written by Samuel Torres, CWP
Career Analyst
Samuel Torres has 10 years of experience in plumbing. He specializes in residential plumbing systems. He has worked with several home improvement companies.
Methodology & Data Source
Salary figures on this page are 2026 projections based on the Bureau of Labor Statistics Occupational Employment and Wage Statistics (OEWS) survey, May 2026 release. The BLS reported a median annual salary of $63,090 for plumbersin the San Luis Obispo metropolitan area. A 2.52% compound annual growth rate (CAGR), calculated from 6-year national BLS wage trends, was applied to project current 2026 compensation. Percentile ranges (P10–P90) represent the full salary distribution across experience levels and practice settings in this market.
Data Sources & Methodology
Source: BLS, OEWS, 7-year dataset (–). Per-city data from annual BLS metropolitan area surveys.
2026 figures are projected from 2025 BLS data using a compound annual growth rate (CAGR) of 2.52%, derived from historical BLS wage trends for plumbers (SOC 47-2152).
Compiled and verified by Samuel Torres, CWP, a licensed plumber with 10+ years of clinical experience. · View source data at BLS.gov