Plumber Salary in San Jose, CA: $110,271 (2026)
Quick Answer:A full-time plumber in San Jose, CA earns a median $110,271/year (≈ $53.01/hour) in nominal terms for 2026 — projected from BLS OEWS 2025 (SOC 47-2152). Once you factor in San Jose's price level (10% above national, BEA RPP 110.4), that paycheck buys what $99,862 would nationally. Nominal pay sits 68.3% above the California state average.
Official BLS data · View source
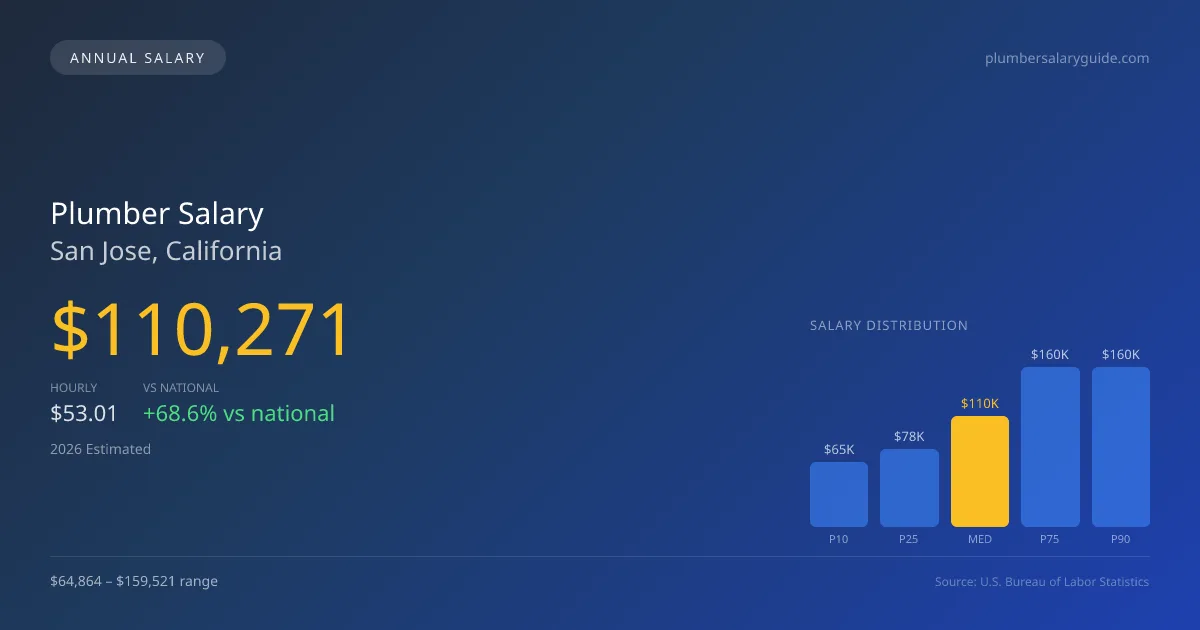
In San Jose, CA, the 2026 median annual salary for plumber positions is projected at $110,271, a substantial figure that highlights the economic appeal of the trade in this area. The range extends from $64,864 at the 10th percentile to $159,521 at the 90th percentile, underscoring the diversity in compensation based on experience, specialization, and employment type. These estimates are derived from 2025 BLS OEWS data projected to 2026, reflecting an attractive salary landscape in comparison to the national median annual salary of $65,408. Factors such as the concentration of high-need industries and ongoing infrastructure developments contribute significantly to the robust demand for plumbing professionals in San Jose.
Salary Breakdown
| Percentile | Annual | Hourly |
|---|---|---|
| Entry Level (P10) | $64,864 | $31.19 |
| Lower Range (P25) | $77,956 | $37.48 |
| Median (P50)(typical) | $110,271 | $53.01 |
| Upper Range (P75) | $159,521 | $76.70 |
| Top Earners (P90) | $159,521 | $76.70 |
Median Salary Position
68.59% above the national average
2026 Salary Percentile Distribution in San Jose
In San Jose, CA, the plumber salary spread from the 10th to 90th percentile is $94,657 (2026 est.). At $110,271, the local median is 68.59% above the national median of $65,408.
Salary Calculator
At 40 hours/week in San Jose: You'd be in the lower-middle range
How San Jose Plumber Pay Compares
San Jose median: $110,271/year (2026)
| Compared To | Median Salary | San Jose Pays |
|---|---|---|
| California Average | $65,520 | +68.30% more |
| National Average | $65,408 | +68.59% more |
Plumbers in San Jose, CA earn a median of $110,271 per year (2026 est.), which is 68.59% higher than the national median of $65,408 and 68.30% above the California state average of $65,520.
Cost-of-Living Adjusted Salary
San Jose has a cost of living 10.42% above the national average.
Adjusted salary = nominal × (100 / CoL index). CoL index: 100 = national average.
San Jose, CA has a cost-of-living index of 110.423 (above the national average of 100). While the nominal salary of $110,271 is competitive, the higher cost of living reduces purchasing power to an effective $99,862 — a 9.44% reduction.
Compare Purchasing Power
Select a city to see how your salary compares after cost of living
Select a city above to compare purchasing power
2019 BLS Actual
$72,780
2025 BLS Actual
$107,560
2026 Current Est.
$110,271
2019–2027 Growth
+55.3%
Salary Trajectory for Plumbers in San Jose (2019–2027)
2019–2025: actual BLS OEWS data for this metro area. 2026+: CAGR 2.52% projection.
| Year | Annual Salary | Status |
|---|---|---|
| 2019 | $72,780 | Actual |
| 2020 | $72,340 | Actual |
| 2021 | $93,670 | Actual |
| 2022 | $82,060 | Actual |
| 2023 | $86,370 | Actual |
| 2024 | $90,220 | Actual |
| 2025 | $107,560 | Actual |
| 2026(current) | $110,271 | Estimated |
| 2027 | $113,049 | Projected |
Based on 7 years of BLS OEWS data for the San Jose metropolitan area, the median plumber salary grew 47.8% from $72,780 (2019) to $107,560 (2025). At a 2.52% compound annual growth rate, salaries are projected to reach $113,049 by 2027 — a total increase of $40,269 (55.33%) from 2019.
Note: Historical values (2019–2025) are actual BLS OEWS figures for the San Jose metropolitan area, sourced from annual Occupational Employment and Wage Statistics surveys. 2026–2026 figures are current estimates, and 2027 values are projections, calculated using a 2.52% CAGR derived from 7-year BLS historical data. Actual salaries may vary based on employer, experience, certifications, and local market conditions.
Salary by Experience Level
| Experience | Estimated Salary Range |
|---|---|
| 0-2 years (New Graduate) | $64,864 – $77,956 |
| 3-5 years (Mid Career) | $77,956 – $110,271 |
| 5+ years (Experienced) | $110,271 – $159,521 |
| 10+ years (Top Earner) | $159,521 – $159,521 |
Plumber salary ranges estimated from BLS percentile data. Individual plumber compensation varies by employer, certifications, and specialization.
Plumber Job Market in San Jose
The local job market showcases a workforce of approximately 3,830 plumbers, reflecting a healthy demand for skilled tradespeople amid the rising cost of living, evidenced by a cost-of-living index of 110.423. This means that while salaries may be higher, take-home pay must effectively meet increased living expenses. Union employment typically commands the highest compensation, with union pipefitter and steamfitter wages often exceeding those in non-union settings by 30-50%. Specialized skills, particularly in medical gas installation or backflow prevention, can also lead to enhanced earnings. The compensation range is influenced by factors such as the type of employer—be it government utilities, large service companies like Roto-Rooter, or self-employed roles—and the varied pay structures associated with commission-based positions in service plumbing. To maximize pay in the San Jose market, plumbers should consider obtaining specialized credentials and pursuing union membership, as these avenues present significant advantages in earnings potential amidst a competitive landscape.
More salary data for San Jose, CA:
Frequently Asked Questions
How much do plumbers make in San Jose, CA in 2026?
Is San Jose, CA a good place to work as a plumber?
Can plumbers make $100K in San Jose?
What is the cost-of-living adjusted plumber salary in San Jose?
How much does a plumber make per hour in San Jose?
Related Pages
Compare Salaries
Career Resources
Nearby Cities in California
Written by Samuel Torres, CWP
Career Analyst
Samuel Torres has 10 years of experience in plumbing. He specializes in residential plumbing systems. He has worked with several home improvement companies.
Methodology & Data Source
Salary figures on this page are 2026 projections based on the Bureau of Labor Statistics Occupational Employment and Wage Statistics (OEWS) survey, May 2026 release. The BLS reported a median annual salary of $107,560 for plumbersin the San Jose metropolitan area. A 2.52% compound annual growth rate (CAGR), calculated from 6-year national BLS wage trends, was applied to project current 2026 compensation. Percentile ranges (P10–P90) represent the full salary distribution across experience levels and practice settings in this market.
Data Sources & Methodology
Source: BLS, OEWS, 7-year dataset (–). Per-city data from annual BLS metropolitan area surveys.
2026 figures are projected from 2025 BLS data using a compound annual growth rate (CAGR) of 2.52%, derived from historical BLS wage trends for plumbers (SOC 47-2152).
Compiled and verified by Samuel Torres, CWP, a licensed plumber with 10+ years of clinical experience. · View source data at BLS.gov