Plumber Salary in San Bernardino, CA: $65,612 (2026)
Quick Answer:A full-time plumber in San Bernardino, CA earns a median $65,612/year (≈ $31.55/hour) in nominal terms for 2026 — projected from BLS OEWS 2025 (SOC 47-2152). Once you factor in San Bernardino's price level (13% above national, BEA RPP 113.1), that paycheck buys what $58,012 would nationally. Nominal pay sits 0.1% above the California state average.
Based on BLS state-level estimates · View source
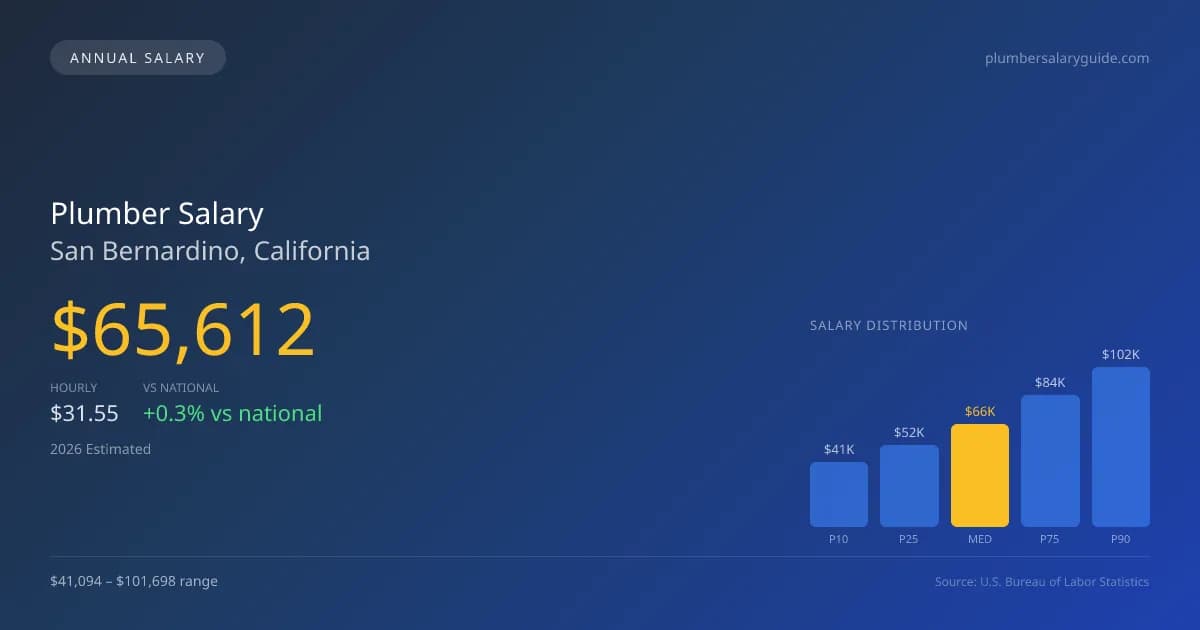
In 2026, plumbers in San Bernardino are projected to earn a median annual salary of $65,612, which is slightly above the national median of $65,408. The salary range for this profession in the area spans from $41,094 at the 10th percentile to $101,698 at the 90th percentile, according to estimates derived from 2025 BLS data and adjusted for local cost of living. This job market primarily features two distinct categories: union pipefitters, who typically command higher wages, and non-union service plumbers. The unionized sector, represented by the United Association, tends to offer salaries 30-50% greater than those found in non-union roles, making it a dominant segment of the plumbing market in San Bernardino.
About the San Bernardino Market
Salary estimated from California average ($82,000) adjusted for local cost of living.
Salary Breakdown
| Percentile | Annual | Hourly |
|---|---|---|
| Entry Level (P10) | $41,094 | $19.76 |
| Lower Range (P25) | $52,083 | $25.04 |
| Median (P50)(typical) | $65,612 | $31.55 |
| Upper Range (P75) | $83,983 | $40.37 |
| Top Earners (P90) | $101,698 | $48.89 |
Median Salary Position
0.31% above the national average
2026 Salary Percentile Distribution in San Bernardino
In San Bernardino, CA, the plumber salary spread from the 10th to 90th percentile is $60,604 (2026 est.). At $65,612, the local median is 0.31% above the national median of $65,408.
Salary Calculator
At 40 hours/week in San Bernardino: You'd be in the lower-middle range
How San Bernardino Plumber Pay Compares
San Bernardino median: $65,612/year (2026)
| Compared To | Median Salary | San Bernardino Pays |
|---|---|---|
| California Average | $65,546 | +0.10% more |
| National Average | $65,408 | +0.31% more |
Plumbers in San Bernardino, CA earn a median of $65,612 per year (2026 est.), which is 0.31% higher than the national median of $65,408 and 0.10% above the California state average of $65,546.
Cost-of-Living Adjusted Salary
San Bernardino has a cost of living 13.10% above the national average.
Adjusted salary = nominal × (100 / CoL index). CoL index: 100 = national average.
San Bernardino, CA has a cost-of-living index of 113.1 (above the national average of 100). While the nominal salary of $65,612 is competitive, the higher cost of living reduces purchasing power to an effective $58,012 — a 11.58% reduction.
Compare Purchasing Power
Select a city to see how your salary compares after cost of living
Select a city above to compare purchasing power
2019 BLS Actual
$55,332
2025 BLS Actual
$63,999
2026 Current Est.
$65,612
2019–2027 Growth
+21.6%
Salary Trajectory for Plumbers in San Bernardino (2019–2027)
2019–2025: actual BLS OEWS data for this metro area. 2026+: CAGR 2.52% projection.
| Year | Annual Salary | Status |
|---|---|---|
| 2019 | $55,332 | Actual |
| 2020 | $56,506 | Actual |
| 2021 | $60,067 | Actual |
| 2022 | $60,277 | Actual |
| 2023 | $61,742 | Actual |
| 2024 | $95,643 | Actual |
| 2025 | $63,999 | Actual |
| 2026(current) | $65,612 | Estimated |
| 2027 | $67,265 | Projected |
Based on 7 years of BLS OEWS data for the San Bernardino metropolitan area, the median plumber salary grew 15.7% from $55,332 (2019) to $63,999 (2025). At a 2.52% compound annual growth rate, salaries are projected to reach $67,265 by 2027 — a total increase of $11,933 (21.57%) from 2019.
Note: Historical values (2019–2025) are actual BLS OEWS figures for the San Bernardino metropolitan area, sourced from annual Occupational Employment and Wage Statistics surveys. 2026–2026 figures are current estimates, and 2027 values are projections, calculated using a 2.52% CAGR derived from 7-year BLS historical data. Actual salaries may vary based on employer, experience, certifications, and local market conditions.
Salary by Experience Level
| Experience | Estimated Salary Range |
|---|---|
| 0-2 years (New Graduate) | $41,094 – $52,083 |
| 3-5 years (Mid Career) | $52,083 – $65,612 |
| 5+ years (Experienced) | $65,612 – $83,983 |
| 10+ years (Top Earner) | $83,983 – $101,698 |
Plumber salary ranges estimated from BLS percentile data. Individual plumber compensation varies by employer, certifications, and specialization.
Plumber Job Market in San Bernardino
The local plumbing job market employs around 33 plumbers, which reflects moderate employment opportunities in the area. With a cost-of-living index of 113.1, earning potential becomes crucial for maintaining a reasonable standard of living. Among the highest-paying employers are union plumbing contractors and large service companies like Roto-Rooter and ARS/Rescue Rooter. The disparity in compensation is driven by several factors, including specialty credentials in medical gas and backflow prevention, as well as the commission structures prevalent in service companies. For maximizing earnings, plumbers in San Bernardino should consider pursuing union affiliations, obtaining advanced licenses, and specializing in high-demand areas like industrial or medical plumbing. The demand for skilled plumbers remains steady due to an aging workforce and infrastructure, further prolonging job stability and potential earnings in this market.
More salary data for San Bernardino, CA:
Frequently Asked Questions
How much do plumbers make in San Bernardino, CA in 2026?
Is San Bernardino, CA a good place to work as a plumber?
Can plumbers make $100K in San Bernardino?
What is the cost-of-living adjusted plumber salary in San Bernardino?
How much does a plumber make per hour in San Bernardino?
Related Pages
Compare Salaries
Career Resources
Nearby Cities in California
Written by Samuel Torres, CWP
Career Analyst
Samuel Torres has 10 years of experience in plumbing. He specializes in residential plumbing systems. He has worked with several home improvement companies.
Methodology & Data Source
Salary figures on this page are 2026 projections based on the Bureau of Labor Statistics Occupational Employment and Wage Statistics (OEWS) survey, May 2026 release. The BLS reported a median annual salary of $63,999 for plumbersin the San Bernardino metropolitan area. A 2.52% compound annual growth rate (CAGR), calculated from 6-year national BLS wage trends, was applied to project current 2026 compensation. Percentile ranges (P10–P90) represent the full salary distribution across experience levels and practice settings in this market.
Data Sources & Methodology
Salary data for San Bernardino is estimated from official BLS state-level occupational wage data (2025), adjusted for regional cost-of-living differences using BEA RPP (Regional Price Parities).
2026 figures are projected from 2025 BLS data using a compound annual growth rate (CAGR) of 2.52%, derived from historical BLS wage trends for plumbers (SOC 47-2152).
Compiled and verified by Samuel Torres, CWP, a licensed plumber with 10+ years of clinical experience. · View source data at BLS.gov