Plumber Salary in Rancho Cucamonga, CA: $66,427 (2026)
Quick Answer:A full-time plumber in Rancho Cucamonga, CA earns a median $66,427/year (≈ $31.93/hour) in nominal terms for 2026 — projected from BLS OEWS 2025 (SOC 47-2152). Once you factor in Rancho Cucamonga's price level (13% above national, BEA RPP 113.1), that paycheck buys what $58,733 would nationally. Nominal pay sits 1.4% above the California state average.
Based on BLS state-level estimates · View source
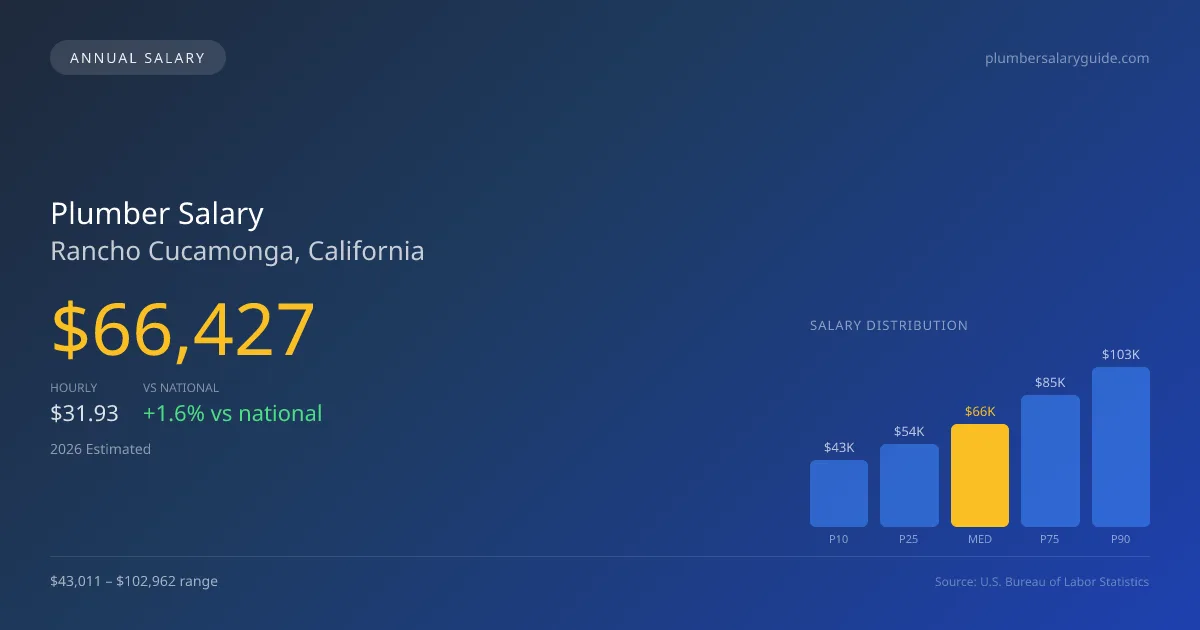
In 2026, plumbers in Rancho Cucamonga, California can expect a median annual salary of $66,427, which slightly exceeds the national median of $65,408. The salary range stretches from an entry-level $43,011 at the 10th percentile to a high of $102,962 at the 90th percentile, reflecting the diverse opportunities available in the market. These figures are based on estimates derived from 2025 BLS data and adjusted for local cost of living in an area that scores above the national average. As the demand for skilled professionals continues to rise, especially in specialty areas like medical gas installation and industrial plumbing, the job market remains robust, underscoring the potential for higher earnings in Rancho Cucamonga.
About the Rancho Cucamonga Market
Salary estimated from California average ($82,000) adjusted for local cost of living.
Salary Breakdown
| Percentile | Annual | Hourly |
|---|---|---|
| Entry Level (P10) | $43,011 | $20.68 |
| Lower Range (P25) | $53,690 | $25.81 |
| Median (P50)(typical) | $66,427 | $31.93 |
| Upper Range (P75) | $85,026 | $40.87 |
| Top Earners (P90) | $102,962 | $49.50 |
Median Salary Position
1.56% above the national average
2026 Salary Percentile Distribution in Rancho Cucamonga
In Rancho Cucamonga, CA, the plumber salary spread from the 10th to 90th percentile is $59,951 (2026 est.). At $66,427, the local median is 1.56% above the national median of $65,408.
Salary Calculator
At 40 hours/week in Rancho Cucamonga: You'd be in the lower-middle range
How Rancho Cucamonga Plumber Pay Compares
Rancho Cucamonga median: $66,427/year (2026)
| Compared To | Median Salary | Rancho Cucamonga Pays |
|---|---|---|
| California Average | $65,510 | +1.40% more |
| National Average | $65,408 | +1.56% more |
Plumbers in Rancho Cucamonga, CA earn a median of $66,427 per year (2026 est.), which is 1.56% higher than the national median of $65,408 and 1.40% above the California state average of $65,510.
Cost-of-Living Adjusted Salary
Rancho Cucamonga has a cost of living 13.10% above the national average.
Adjusted salary = nominal × (100 / CoL index). CoL index: 100 = national average.
Rancho Cucamonga, CA has a cost-of-living index of 113.1 (above the national average of 100). While the nominal salary of $66,427 is competitive, the higher cost of living reduces purchasing power to an effective $58,733 — a 11.58% reduction.
Compare Purchasing Power
Select a city to see how your salary compares after cost of living
Select a city above to compare purchasing power
2019 BLS Actual
$56,019
2025 BLS Actual
$64,794
2026 Current Est.
$66,427
2019–2027 Growth
+21.6%
Salary Trajectory for Plumbers in Rancho Cucamonga (2019–2027)
2019–2025: actual BLS OEWS data for this metro area. 2026+: CAGR 2.52% projection.
| Year | Annual Salary | Status |
|---|---|---|
| 2019 | $56,019 | Actual |
| 2020 | $57,208 | Actual |
| 2021 | $60,813 | Actual |
| 2022 | $61,026 | Actual |
| 2023 | $62,509 | Actual |
| 2024 | $94,010 | Actual |
| 2025 | $64,794 | Actual |
| 2026(current) | $66,427 | Estimated |
| 2027 | $68,101 | Projected |
Based on 7 years of BLS OEWS data for the Rancho Cucamonga metropolitan area, the median plumber salary grew 15.7% from $56,019 (2019) to $64,794 (2025). At a 2.52% compound annual growth rate, salaries are projected to reach $68,101 by 2027 — a total increase of $12,082 (21.57%) from 2019.
Note: Historical values (2019–2025) are actual BLS OEWS figures for the Rancho Cucamonga metropolitan area, sourced from annual Occupational Employment and Wage Statistics surveys. 2026–2026 figures are current estimates, and 2027 values are projections, calculated using a 2.52% CAGR derived from 7-year BLS historical data. Actual salaries may vary based on employer, experience, certifications, and local market conditions.
Salary by Experience Level
| Experience | Estimated Salary Range |
|---|---|
| 0-2 years (New Graduate) | $43,011 – $53,690 |
| 3-5 years (Mid Career) | $53,690 – $66,427 |
| 5+ years (Experienced) | $66,427 – $85,026 |
| 10+ years (Top Earner) | $85,026 – $102,962 |
Plumber salary ranges estimated from BLS percentile data. Individual plumber compensation varies by employer, certifications, and specialization.
Plumber Job Market in Rancho Cucamonga
Employment data shows 46 plumbers are actively working in the Rancho Cucamonga area. With a cost of living index of 113.1, the reality is that while salaries are competitive, the purchasing power may be affected by local expenses. To maximize earnings, plumbers should consider affiliations with union plumbing contractors, which typically offer higher pay compared to non-union counterparts. Special skills such as medical gas handling and obtaining necessary licenses can lead to greater financial rewards. Self-employed plumbers and those in commission-based roles at larger service companies like Roto-Rooter may also find lucrative opportunities. Understanding the differences in pay across sectors—where union wages can surpass non-union rates by 30-50%—is essential for anyone looking to customize their earning potential in this growing job market.
More salary data for Rancho Cucamonga, CA:
Frequently Asked Questions
How much do plumbers make in Rancho Cucamonga, CA in 2026?
Is Rancho Cucamonga, CA a good place to work as a plumber?
Can plumbers make $100K in Rancho Cucamonga?
What is the cost-of-living adjusted plumber salary in Rancho Cucamonga?
How much does a plumber make per hour in Rancho Cucamonga?
Related Pages
Compare Salaries
Career Resources
Nearby Cities in California
Written by Samuel Torres, CWP
Career Analyst
Samuel Torres has 10 years of experience in plumbing. He specializes in residential plumbing systems. He has worked with several home improvement companies.
Methodology & Data Source
Salary figures on this page are 2026 projections based on the Bureau of Labor Statistics Occupational Employment and Wage Statistics (OEWS) survey, May 2026 release. The BLS reported a median annual salary of $64,794 for plumbersin the Rancho Cucamonga metropolitan area. A 2.52% compound annual growth rate (CAGR), calculated from 6-year national BLS wage trends, was applied to project current 2026 compensation. Percentile ranges (P10–P90) represent the full salary distribution across experience levels and practice settings in this market.
Data Sources & Methodology
Salary data for Rancho Cucamonga is estimated from official BLS state-level occupational wage data (2025), adjusted for regional cost-of-living differences using BEA RPP (Regional Price Parities).
2026 figures are projected from 2025 BLS data using a compound annual growth rate (CAGR) of 2.52%, derived from historical BLS wage trends for plumbers (SOC 47-2152).
Compiled and verified by Samuel Torres, CWP, a licensed plumber with 10+ years of clinical experience. · View source data at BLS.gov