Plumber Salary in Porterville, CA: $64,857 (2026)
Quick Answer:A full-time plumber in Porterville, CA earns a median $64,857/year (≈ $31.18/hour) in nominal terms for 2026 — projected from BLS OEWS 2025 (SOC 47-2152). Once you factor in Porterville's price level (13% above national, BEA RPP 113.1), that paycheck buys what $57,345 would nationally. Nominal pay sits 1.0% below the California state average.
Based on BLS state-level estimates · View source
In Porterville, California, the projected median annual salary for plumbers in 2026 is $64,857, slightly below the national average of $65,408. This compensation landscape presents a salary range from $42,495 at the lower 10th percentile to $100,529 at the 90th percentile, indicating a broad disparity based on experience, specialization, and employment type. Estimates derived from BLS state-level data and regional price parities reflect a job market heavily influenced by the prevalence of union vs. non-union rates in the area. Union pipefitters, particularly those aligned with the UA (United Association), often enjoy a significant edge in pay, sometimes commanding up to 50% more than their non-union counterparts. This dynamic creates an interesting challenge for non-union plumbers seeking competitive wages in a market where union skills like medical gas fitting can further enhance earning potential.
About the Porterville Market
Salary estimated from California average ($82,000) adjusted for local cost of living.
Salary Breakdown
| Percentile | Annual | Hourly |
|---|---|---|
| Entry Level (P10) | $42,495 | $20.43 |
| Lower Range (P25) | $52,638 | $25.30 |
| Median (P50)(typical) | $64,857 | $31.18 |
| Upper Range (P75) | $83,018 | $39.91 |
| Top Earners (P90) | $100,529 | $48.33 |
Median Salary Position
0.84% below the national average
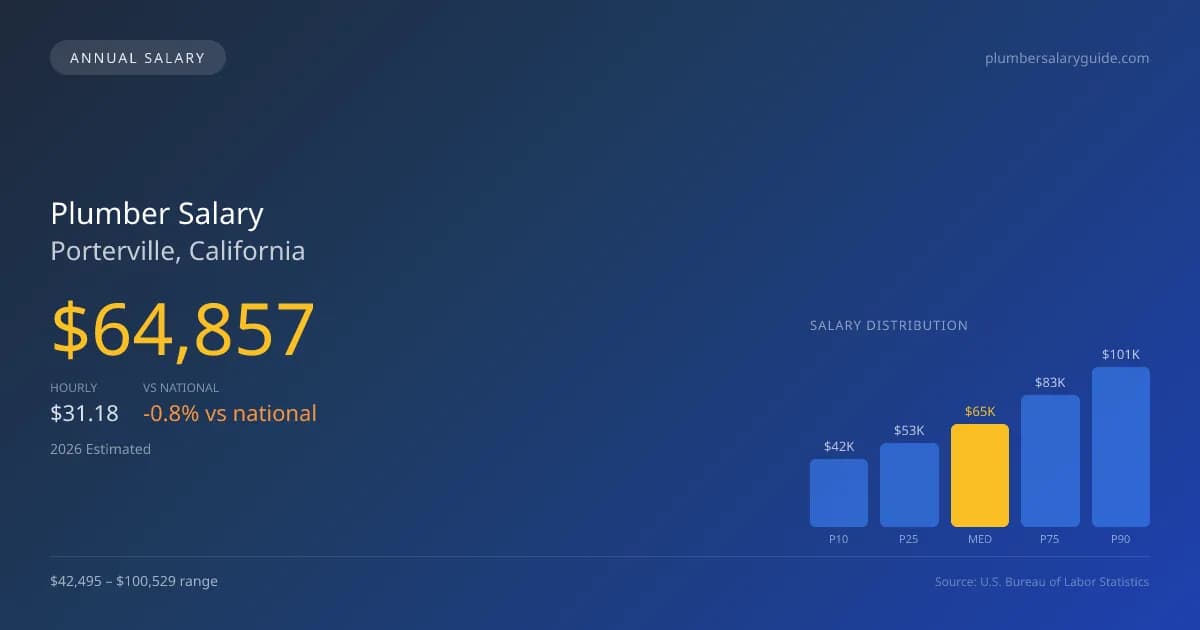
2026 Salary Percentile Distribution in Porterville
In Porterville, CA, the plumber salary spread from the 10th to 90th percentile is $58,034 (2026 est.). At $64,857, the local median is 0.84% below the national median of $65,408.
Salary Calculator
At 40 hours/week in Porterville: You'd be in the lower-middle range
How Porterville Plumber Pay Compares
Porterville median: $64,857/year (2026)
| Compared To | Median Salary | Porterville Pays |
|---|---|---|
| California Average | $65,512 | -1.00% less |
| National Average | $65,408 | -0.84% less |
Plumbers in Porterville, CA earn a median of $64,857 per year (2026 est.), which is 0.84% lower than the national median of $65,408 and 1.00% below the California state average of $65,512.
Cost-of-Living Adjusted Salary
Porterville has a cost of living 13.10% above the national average.
Adjusted salary = nominal × (100 / CoL index). CoL index: 100 = national average.
Porterville, CA has a cost-of-living index of 113.1 (above the national average of 100). While the nominal salary of $64,857 is competitive, the higher cost of living reduces purchasing power to an effective $57,345 — a 11.58% reduction.
Compare Purchasing Power
Select a city to see how your salary compares after cost of living
Select a city above to compare purchasing power
2019 BLS Actual
$54,696
2025 BLS Actual
$63,263
2026 Current Est.
$64,857
2019–2027 Growth
+21.6%
Salary Trajectory for Plumbers in Porterville (2019–2027)
2019–2025: actual BLS OEWS data for this metro area. 2026+: CAGR 2.52% projection.
| Year | Annual Salary | Status |
|---|---|---|
| 2019 | $54,696 | Actual |
| 2020 | $55,856 | Actual |
| 2021 | $59,376 | Actual |
| 2022 | $59,584 | Actual |
| 2023 | $61,032 | Actual |
| 2024 | $91,789 | Actual |
| 2025 | $63,263 | Actual |
| 2026(current) | $64,857 | Estimated |
| 2027 | $66,492 | Projected |
Based on 7 years of BLS OEWS data for the Porterville metropolitan area, the median plumber salary grew 15.7% from $54,696 (2019) to $63,263 (2025). At a 2.52% compound annual growth rate, salaries are projected to reach $66,492 by 2027 — a total increase of $11,796 (21.57%) from 2019.
Note: Historical values (2019–2025) are actual BLS OEWS figures for the Porterville metropolitan area, sourced from annual Occupational Employment and Wage Statistics surveys. 2026–2026 figures are current estimates, and 2027 values are projections, calculated using a 2.52% CAGR derived from 7-year BLS historical data. Actual salaries may vary based on employer, experience, certifications, and local market conditions.
Salary by Experience Level
| Experience | Estimated Salary Range |
|---|---|
| 0-2 years (New Graduate) | $42,495 – $52,638 |
| 3-5 years (Mid Career) | $52,638 – $64,857 |
| 5+ years (Experienced) | $64,857 – $83,018 |
| 10+ years (Top Earner) | $83,018 – $100,529 |
Plumber salary ranges estimated from BLS percentile data. Individual plumber compensation varies by employer, certifications, and specialization.
Plumber Job Market in Porterville
The local job market for plumbers in Porterville includes 11 plumbers, which suggests a tight and potentially competitive environment for job seekers. With a cost-of-living index of 113.1, take-home pay may be impacted as living expenses outweigh the national average. Employers who offer competitive salaries vary from union plumbing contractors to large service companies like Roto-Rooter and ARS, which often provide commission structures that introduce variability in earnings. Higher wages can be observed among those working in industrial settings or as self-employed contractors, while specialty plumbing roles, such as medical gas installation, promise even higher rewards but require advanced certifications. This spread in compensation is driven by factors such as licensing requirements, the skill level needed for certain plumbing specialties, and the availability of overtime in certain roles. To maximize earnings in the Porterville market, aspiring plumbers should consider pursuing advanced licenses, specializing in high-demand areas, and evaluating union membership, which could significantly impact overall earnings and job stability.
More salary data for Porterville, CA:
Frequently Asked Questions
How much do plumbers make in Porterville, CA in 2026?
Is Porterville, CA a good place to work as a plumber?
Can plumbers make $100K in Porterville?
What is the cost-of-living adjusted plumber salary in Porterville?
How much does a plumber make per hour in Porterville?
Related Pages
Compare Salaries
Career Resources
Nearby Cities in California
Written by Samuel Torres, CWP
Career Analyst
Samuel Torres has 10 years of experience in plumbing. He specializes in residential plumbing systems. He has worked with several home improvement companies.
Methodology & Data Source
Salary figures on this page are 2026 projections based on the Bureau of Labor Statistics Occupational Employment and Wage Statistics (OEWS) survey, May 2026 release. The BLS reported a median annual salary of $63,263 for plumbersin the Porterville metropolitan area. A 2.52% compound annual growth rate (CAGR), calculated from 6-year national BLS wage trends, was applied to project current 2026 compensation. Percentile ranges (P10–P90) represent the full salary distribution across experience levels and practice settings in this market.
Data Sources & Methodology
Salary data for Porterville is estimated from official BLS state-level occupational wage data (2025), adjusted for regional cost-of-living differences using BEA RPP (Regional Price Parities).
2026 figures are projected from 2025 BLS data using a compound annual growth rate (CAGR) of 2.52%, derived from historical BLS wage trends for plumbers (SOC 47-2152).
Compiled and verified by Samuel Torres, CWP, a licensed plumber with 10+ years of clinical experience. · View source data at BLS.gov