Plumber Salary in Orange, CA: $64,553 (2026)
Quick Answer:A full-time plumber in Orange, CA earns a median $64,553/year (≈ $31.03/hour) in nominal terms for 2026 — projected from BLS OEWS 2025 (SOC 47-2152). Once you factor in Orange's price level (13% above national, BEA RPP 113.1), that paycheck buys what $57,076 would nationally. Nominal pay sits 1.5% below the California state average.
Based on BLS state-level estimates · View source
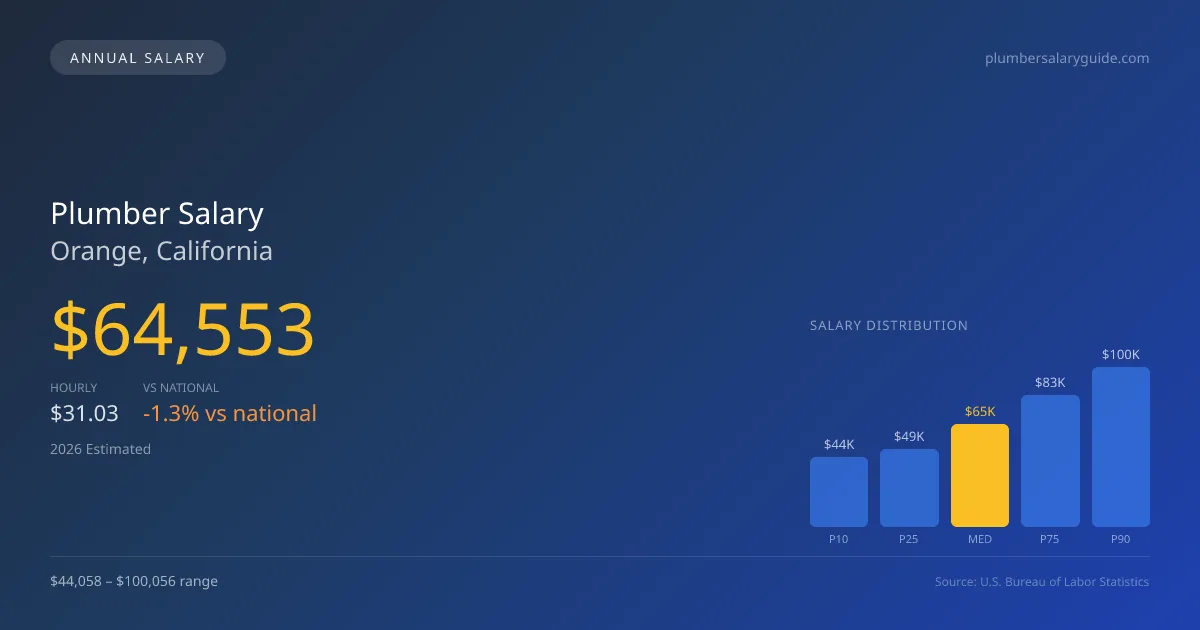
In 2026, plumbers in Orange, California, can expect a median annual salary of $64,553, slightly lower than the national median of $65,408. The salary range varies significantly, from $44,058 at the lower end to a top earning potential of $100,056 for those in high-demand specialties. These figures, based on projections derived from 2025 BLS data and regional cost adjustments, highlight the competitive nature of the local plumbing market. Specialties such as medical gas installation and underground utility work often command a premium, further elevating earning potential within the industry and presenting strong opportunities for skilled professionals in Orange.
About the Orange Market
Salary estimated from California average ($82,000) adjusted for local cost of living.
Salary Breakdown
| Percentile | Annual | Hourly |
|---|---|---|
| Entry Level (P10) | $44,058 | $21.18 |
| Lower Range (P25) | $48,604 | $23.36 |
| Median (P50)(typical) | $64,553 | $31.03 |
| Upper Range (P75) | $82,627 | $39.73 |
| Top Earners (P90) | $100,056 | $48.10 |
Median Salary Position
1.31% below the national average
2026 Salary Percentile Distribution in Orange
In Orange, CA, the plumber salary spread from the 10th to 90th percentile is $55,998 (2026 est.). At $64,553, the local median is 1.31% below the national median of $65,408.
Salary Calculator
At 40 hours/week in Orange: You'd be in the lower-middle range
How Orange Plumber Pay Compares
Orange median: $64,553/year (2026)
| Compared To | Median Salary | Orange Pays |
|---|---|---|
| California Average | $65,536 | -1.50% less |
| National Average | $65,408 | -1.31% less |
Plumbers in Orange, CA earn a median of $64,553 per year (2026 est.), which is 1.31% lower than the national median of $65,408 and 1.50% below the California state average of $65,536.
Cost-of-Living Adjusted Salary
Orange has a cost of living 13.10% above the national average.
Adjusted salary = nominal × (100 / CoL index). CoL index: 100 = national average.
Orange, CA has a cost-of-living index of 113.1 (above the national average of 100). While the nominal salary of $64,553 is competitive, the higher cost of living reduces purchasing power to an effective $57,076 — a 11.58% reduction.
Compare Purchasing Power
Select a city to see how your salary compares after cost of living
Select a city above to compare purchasing power
2019 BLS Actual
$54,439
2025 BLS Actual
$62,966
2026 Current Est.
$64,553
2019–2027 Growth
+21.6%
Salary Trajectory for Plumbers in Orange (2019–2027)
2019–2025: actual BLS OEWS data for this metro area. 2026+: CAGR 2.52% projection.
| Year | Annual Salary | Status |
|---|---|---|
| 2019 | $54,439 | Actual |
| 2020 | $55,594 | Actual |
| 2021 | $59,097 | Actual |
| 2022 | $59,304 | Actual |
| 2023 | $60,745 | Actual |
| 2024 | $91,358 | Actual |
| 2025 | $62,966 | Actual |
| 2026(current) | $64,553 | Estimated |
| 2027 | $66,179 | Projected |
Based on 7 years of BLS OEWS data for the Orange metropolitan area, the median plumber salary grew 15.7% from $54,439 (2019) to $62,966 (2025). At a 2.52% compound annual growth rate, salaries are projected to reach $66,179 by 2027 — a total increase of $11,740 (21.57%) from 2019.
Note: Historical values (2019–2025) are actual BLS OEWS figures for the Orange metropolitan area, sourced from annual Occupational Employment and Wage Statistics surveys. 2026–2026 figures are current estimates, and 2027 values are projections, calculated using a 2.52% CAGR derived from 7-year BLS historical data. Actual salaries may vary based on employer, experience, certifications, and local market conditions.
Salary by Experience Level
| Experience | Estimated Salary Range |
|---|---|
| 0-2 years (New Graduate) | $44,058 – $48,604 |
| 3-5 years (Mid Career) | $48,604 – $64,553 |
| 5+ years (Experienced) | $64,553 – $82,627 |
| 10+ years (Top Earner) | $82,627 – $100,056 |
Plumber salary ranges estimated from BLS percentile data. Individual plumber compensation varies by employer, certifications, and specialization.
Plumber Job Market in Orange
The local plumbing job market employs around 21 plumbers, reflecting a compact but focused community. However, the cost of living in Orange, represented by a CoL index of 113.1, can impact take-home pay and purchasing power. Employers such as union plumbing contractors, which typically offer pay premiums, alongside non-union and open-shop contractors, drive salary differences. Factors influencing compensation include the specialization in areas like medical gas and industrial piping, as well as whether plumbers hold a master license or contractor license—credentials that unlock higher earning potential. Plumbers looking to maximize their pay should consider aligning with union workplaces, specializing in in-demand services, and pursuing additional certifications to enhance their skill set and marketability.
More salary data for Orange, CA:
Frequently Asked Questions
How much do plumbers make in Orange, CA in 2026?
Is Orange, CA a good place to work as a plumber?
Can plumbers make $100K in Orange?
What is the cost-of-living adjusted plumber salary in Orange?
How much does a plumber make per hour in Orange?
Related Pages
Compare Salaries
Career Resources
Nearby Cities in California
Written by Samuel Torres, CWP
Career Analyst
Samuel Torres has 10 years of experience in plumbing. He specializes in residential plumbing systems. He has worked with several home improvement companies.
Methodology & Data Source
Salary figures on this page are 2026 projections based on the Bureau of Labor Statistics Occupational Employment and Wage Statistics (OEWS) survey, May 2026 release. The BLS reported a median annual salary of $62,966 for plumbersin the Orange metropolitan area. A 2.52% compound annual growth rate (CAGR), calculated from 6-year national BLS wage trends, was applied to project current 2026 compensation. Percentile ranges (P10–P90) represent the full salary distribution across experience levels and practice settings in this market.
Data Sources & Methodology
Salary data for Orange is estimated from official BLS state-level occupational wage data (2025), adjusted for regional cost-of-living differences using BEA RPP (Regional Price Parities).
2026 figures are projected from 2025 BLS data using a compound annual growth rate (CAGR) of 2.52%, derived from historical BLS wage trends for plumbers (SOC 47-2152).
Compiled and verified by Samuel Torres, CWP, a licensed plumber with 10+ years of clinical experience. · View source data at BLS.gov