Plumber Salary in Oakley, CA: $63,435 (2026)
Quick Answer:A full-time plumber in Oakley, CA earns a median $63,435/year (≈ $30.50/hour) in nominal terms for 2026 — projected from BLS OEWS 2025 (SOC 47-2152). Once you factor in Oakley's price level (13% above national, BEA RPP 113.1), that paycheck buys what $56,088 would nationally. Nominal pay sits 3.2% below the California state average.
Based on BLS state-level estimates · View source
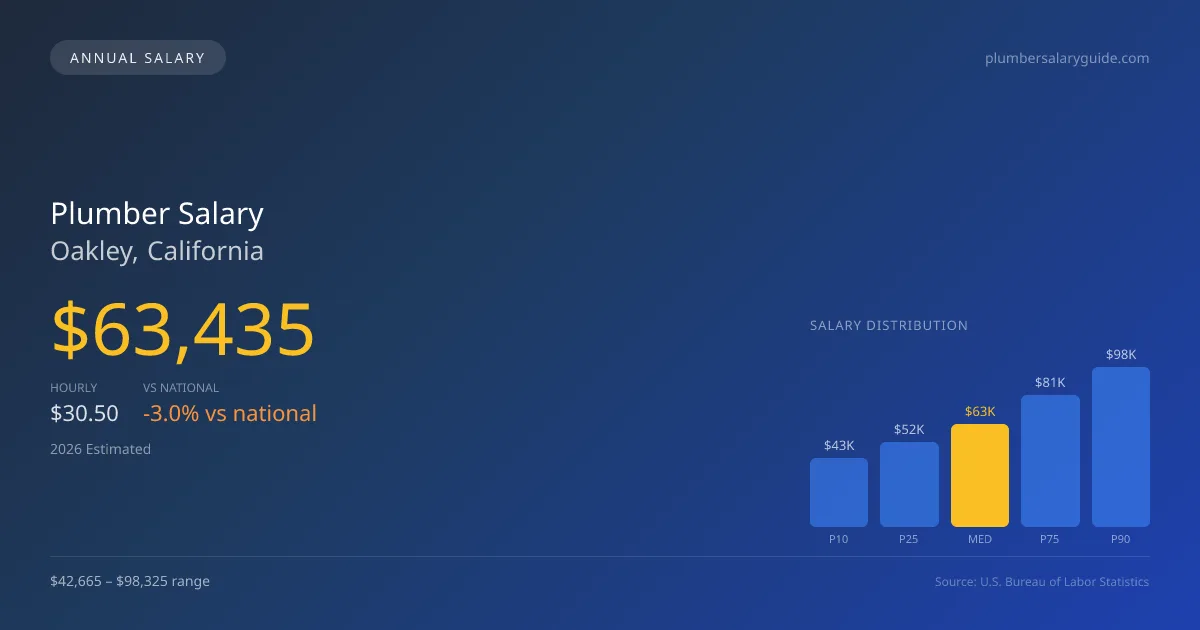
In Oakley, California, the prevailing plumber salary stands at $63,435 for 2026, which is slightly below the national median. The salary range for plumbers extends from $42,665 at the 10th percentile to $98,325 at the 90th percentile, illustrating a notable wage disparity influenced by union affiliations, with UA union pipefitters typically earning 30-50% more compared to their non-union counterparts. These statistics are derived from recent estimates based on 2025 BLS data, adjusted for regional cost factors, offering a snapshot of the local market. Oakley’s plumbing job market, while modest with only eight employed plumbers, indicates a competitive environment where skilled tradespeople can leverage specialized certifications to enhance earnings.
About the Oakley Market
Salary estimated from California average ($82,000) adjusted for local cost of living.
Salary Breakdown
| Percentile | Annual | Hourly |
|---|---|---|
| Entry Level (P10) | $42,665 | $20.51 |
| Lower Range (P25) | $52,138 | $25.07 |
| Median (P50)(typical) | $63,435 | $30.50 |
| Upper Range (P75) | $81,197 | $39.04 |
| Top Earners (P90) | $98,325 | $47.27 |
Median Salary Position
3.02% below the national average
2026 Salary Percentile Distribution in Oakley
In Oakley, CA, the plumber salary spread from the 10th to 90th percentile is $55,660 (2026 est.). At $63,435, the local median is 3.02% below the national median of $65,408.
Salary Calculator
At 40 hours/week in Oakley: You'd be in the lower-middle range
How Oakley Plumber Pay Compares
Oakley median: $63,435/year (2026)
| Compared To | Median Salary | Oakley Pays |
|---|---|---|
| California Average | $65,532 | -3.20% less |
| National Average | $65,408 | -3.02% less |
Plumbers in Oakley, CA earn a median of $63,435 per year (2026 est.), which is 3.02% lower than the national median of $65,408 and 3.20% below the California state average of $65,532.
Cost-of-Living Adjusted Salary
Oakley has a cost of living 13.10% above the national average.
Adjusted salary = nominal × (100 / CoL index). CoL index: 100 = national average.
Oakley, CA has a cost-of-living index of 113.1 (above the national average of 100). While the nominal salary of $63,435 is competitive, the higher cost of living reduces purchasing power to an effective $56,088 — a 11.58% reduction.
Compare Purchasing Power
Select a city to see how your salary compares after cost of living
Select a city above to compare purchasing power
2019 BLS Actual
$53,497
2025 BLS Actual
$61,876
2026 Current Est.
$63,435
2019–2027 Growth
+21.6%
Salary Trajectory for Plumbers in Oakley (2019–2027)
2019–2025: actual BLS OEWS data for this metro area. 2026+: CAGR 2.52% projection.
| Year | Annual Salary | Status |
|---|---|---|
| 2019 | $53,497 | Actual |
| 2020 | $54,631 | Actual |
| 2021 | $58,074 | Actual |
| 2022 | $58,278 | Actual |
| 2023 | $59,694 | Actual |
| 2024 | $89,776 | Actual |
| 2025 | $61,876 | Actual |
| 2026(current) | $63,435 | Estimated |
| 2027 | $65,034 | Projected |
Based on 7 years of BLS OEWS data for the Oakley metropolitan area, the median plumber salary grew 15.7% from $53,497 (2019) to $61,876 (2025). At a 2.52% compound annual growth rate, salaries are projected to reach $65,034 by 2027 — a total increase of $11,537 (21.57%) from 2019.
Note: Historical values (2019–2025) are actual BLS OEWS figures for the Oakley metropolitan area, sourced from annual Occupational Employment and Wage Statistics surveys. 2026–2026 figures are current estimates, and 2027 values are projections, calculated using a 2.52% CAGR derived from 7-year BLS historical data. Actual salaries may vary based on employer, experience, certifications, and local market conditions.
Salary by Experience Level
| Experience | Estimated Salary Range |
|---|---|
| 0-2 years (New Graduate) | $42,665 – $52,138 |
| 3-5 years (Mid Career) | $52,138 – $63,435 |
| 5+ years (Experienced) | $63,435 – $81,197 |
| 10+ years (Top Earner) | $81,197 – $98,325 |
Plumber salary ranges estimated from BLS percentile data. Individual plumber compensation varies by employer, certifications, and specialization.
Plumber Job Market in Oakley
Examining the broader context of plumber pay in Oakley CA reveals how the cost of living, indexed at 113.1, affects take-home pay. This elevation in living expenses implies that while salaries may be appealing, the purchasing power could be compromised. Employers in the area such as UA signatory contractors lead in compensation, while non-union service companies, industrial maintenance teams, and self-employed plumbers navigate the variability in income. Factors contributing to wage variances include specialty skills in areas like medical gas, commission structures in large service firms, and the potential for overtime among union workers. For those aiming to maximize their pay in Oakley, pursuing a master plumbing license, gaining specialized training, or exploring self-employment could provide significant advantages in a competitive landscape marked by an aging workforce and sustained demand for plumbing services.
More salary data for Oakley, CA:
Frequently Asked Questions
How much do plumbers make in Oakley, CA in 2026?
Is Oakley, CA a good place to work as a plumber?
Can plumbers make $100K in Oakley?
What is the cost-of-living adjusted plumber salary in Oakley?
How much does a plumber make per hour in Oakley?
Related Pages
Compare Salaries
Career Resources
Nearby Cities in California
Written by Samuel Torres, CWP
Career Analyst
Samuel Torres has 10 years of experience in plumbing. He specializes in residential plumbing systems. He has worked with several home improvement companies.
Methodology & Data Source
Salary figures on this page are 2026 projections based on the Bureau of Labor Statistics Occupational Employment and Wage Statistics (OEWS) survey, May 2026 release. The BLS reported a median annual salary of $61,876 for plumbersin the Oakley metropolitan area. A 2.52% compound annual growth rate (CAGR), calculated from 6-year national BLS wage trends, was applied to project current 2026 compensation. Percentile ranges (P10–P90) represent the full salary distribution across experience levels and practice settings in this market.
Data Sources & Methodology
Salary data for Oakley is estimated from official BLS state-level occupational wage data (2025), adjusted for regional cost-of-living differences using BEA RPP (Regional Price Parities).
2026 figures are projected from 2025 BLS data using a compound annual growth rate (CAGR) of 2.52%, derived from historical BLS wage trends for plumbers (SOC 47-2152).
Compiled and verified by Samuel Torres, CWP, a licensed plumber with 10+ years of clinical experience. · View source data at BLS.gov