Plumber Salary in Newport Beach, CA: $64,105 (2026)
Quick Answer:A full-time plumber in Newport Beach, CA earns a median $64,105/year (≈ $30.82/hour) in nominal terms for 2026 — projected from BLS OEWS 2025 (SOC 47-2152). Once you factor in Newport Beach's price level (13% above national, BEA RPP 113.1), that paycheck buys what $56,680 would nationally. Nominal pay sits 2.2% below the California state average.
Based on BLS state-level estimates · View source
In Newport Beach, California, plumbers can expect a median annual salary of $64,105 in 2026, slightly below the national median of $65,408. Salary ranges for plumbers in this region vary significantly, with the lowest earners making approximately $45,940 and the highest reaching about $99,362. These figures are estimates derived from BLS state-level data, adjusted for local cost of living factors. Specifically, Newport Beach's job market features a unique demand for skilled specialties, including medical gas and industrial plumbing, which can further enhance earning potential for those with the necessary certifications and experience in these high-demand areas.
About the Newport Beach Market
Salary estimated from California average ($82,000) adjusted for local cost of living.
Salary Breakdown
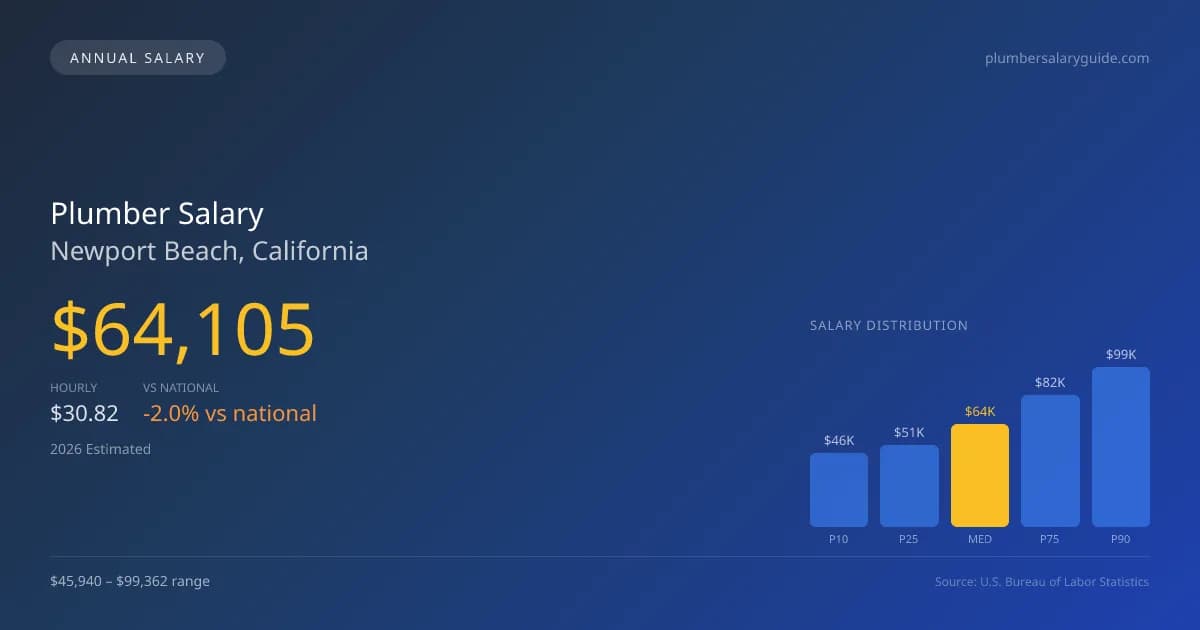
| Percentile | Annual | Hourly |
|---|---|---|
| Entry Level (P10) | $45,940 | $22.08 |
| Lower Range (P25) | $51,134 | $24.58 |
| Median (P50)(typical) | $64,105 | $30.82 |
| Upper Range (P75) | $82,054 | $39.45 |
| Top Earners (P90) | $99,362 | $47.77 |
Median Salary Position
1.99% below the national average
2026 Salary Percentile Distribution in Newport Beach
In Newport Beach, CA, the plumber salary spread from the 10th to 90th percentile is $53,422 (2026 est.). At $64,105, the local median is 1.99% below the national median of $65,408.
Salary Calculator
At 40 hours/week in Newport Beach: You'd be in the lower-middle range
How Newport Beach Plumber Pay Compares
Newport Beach median: $64,105/year (2026)
| Compared To | Median Salary | Newport Beach Pays |
|---|---|---|
| California Average | $65,547 | -2.20% less |
| National Average | $65,408 | -1.99% less |
Plumbers in Newport Beach, CA earn a median of $64,105 per year (2026 est.), which is 1.99% lower than the national median of $65,408 and 2.20% below the California state average of $65,547.
Cost-of-Living Adjusted Salary
Newport Beach has a cost of living 13.10% above the national average.
Adjusted salary = nominal × (100 / CoL index). CoL index: 100 = national average.
Newport Beach, CA has a cost-of-living index of 113.1 (above the national average of 100). While the nominal salary of $64,105 is competitive, the higher cost of living reduces purchasing power to an effective $56,680 — a 11.58% reduction.
Compare Purchasing Power
Select a city to see how your salary compares after cost of living
Select a city above to compare purchasing power
2019 BLS Actual
$54,061
2025 BLS Actual
$62,529
2026 Current Est.
$64,105
2019–2027 Growth
+21.6%
Salary Trajectory for Plumbers in Newport Beach (2019–2027)
2019–2025: actual BLS OEWS data for this metro area. 2026+: CAGR 2.52% projection.
| Year | Annual Salary | Status |
|---|---|---|
| 2019 | $54,061 | Actual |
| 2020 | $55,208 | Actual |
| 2021 | $58,687 | Actual |
| 2022 | $58,893 | Actual |
| 2023 | $60,324 | Actual |
| 2024 | $90,724 | Actual |
| 2025 | $62,529 | Actual |
| 2026(current) | $64,105 | Estimated |
| 2027 | $65,720 | Projected |
Based on 7 years of BLS OEWS data for the Newport Beach metropolitan area, the median plumber salary grew 15.7% from $54,061 (2019) to $62,529 (2025). At a 2.52% compound annual growth rate, salaries are projected to reach $65,720 by 2027 — a total increase of $11,659 (21.57%) from 2019.
Note: Historical values (2019–2025) are actual BLS OEWS figures for the Newport Beach metropolitan area, sourced from annual Occupational Employment and Wage Statistics surveys. 2026–2026 figures are current estimates, and 2027 values are projections, calculated using a 2.52% CAGR derived from 7-year BLS historical data. Actual salaries may vary based on employer, experience, certifications, and local market conditions.
Salary by Experience Level
| Experience | Estimated Salary Range |
|---|---|
| 0-2 years (New Graduate) | $45,940 – $51,134 |
| 3-5 years (Mid Career) | $51,134 – $64,105 |
| 5+ years (Experienced) | $64,105 – $82,054 |
| 10+ years (Top Earner) | $82,054 – $99,362 |
Plumber salary ranges estimated from BLS percentile data. Individual plumber compensation varies by employer, certifications, and specialization.
Plumber Job Market in Newport Beach
The local plumbing job market shows strong demand with only 12 employed plumbers, indicating a competitive environment that can drive wages up. A cost-of-living index of 113.1 signifies that expenses in Newport Beach are higher than the national average, which influences take-home purchasing power for plumbers in the area. Employers who typically pay the highest wages include union plumbing contractors associated with the UA, as well as industrial maintenance teams in sectors like manufacturing. The variation in plumber pay in Newport Beach CA stems largely from factors such as union versus non-union employment, specialty skills, and additional licenses, with master plumbers and contractors often commanding higher rates. To maximize earnings, plumbers should consider obtaining specialty credentials, engaging in continuous professional development, and exploring opportunities in higher-paying sectors such as industrial maintenance and medical gas services.
More salary data for Newport Beach, CA:
Frequently Asked Questions
How much do plumbers make in Newport Beach, CA in 2026?
Is Newport Beach, CA a good place to work as a plumber?
Can plumbers make $100K in Newport Beach?
What is the cost-of-living adjusted plumber salary in Newport Beach?
How much does a plumber make per hour in Newport Beach?
Related Pages
Compare Salaries
Career Resources
Nearby Cities in California
Written by Samuel Torres, CWP
Career Analyst
Samuel Torres has 10 years of experience in plumbing. He specializes in residential plumbing systems. He has worked with several home improvement companies.
Methodology & Data Source
Salary figures on this page are 2026 projections based on the Bureau of Labor Statistics Occupational Employment and Wage Statistics (OEWS) survey, May 2026 release. The BLS reported a median annual salary of $62,529 for plumbersin the Newport Beach metropolitan area. A 2.52% compound annual growth rate (CAGR), calculated from 6-year national BLS wage trends, was applied to project current 2026 compensation. Percentile ranges (P10–P90) represent the full salary distribution across experience levels and practice settings in this market.
Data Sources & Methodology
Salary data for Newport Beach is estimated from official BLS state-level occupational wage data (2025), adjusted for regional cost-of-living differences using BEA RPP (Regional Price Parities).
2026 figures are projected from 2025 BLS data using a compound annual growth rate (CAGR) of 2.52%, derived from historical BLS wage trends for plumbers (SOC 47-2152).
Compiled and verified by Samuel Torres, CWP, a licensed plumber with 10+ years of clinical experience. · View source data at BLS.gov